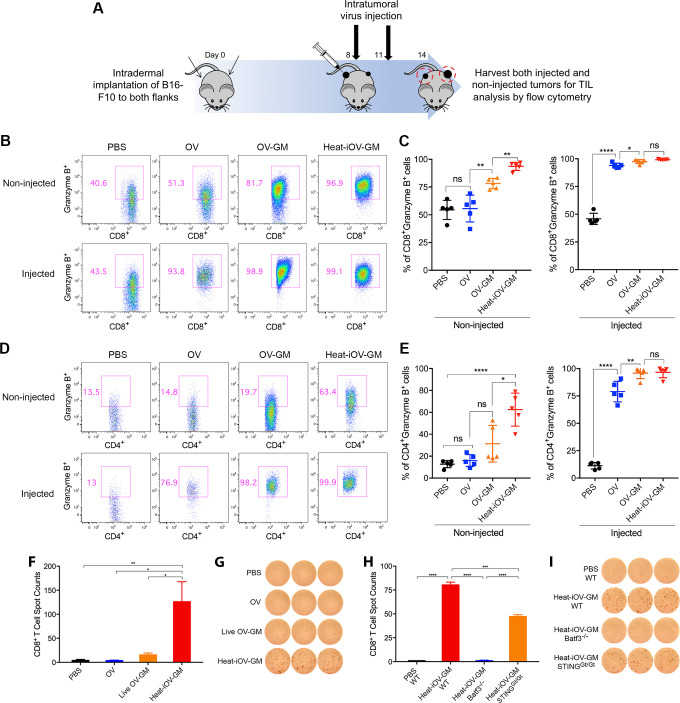
Figure 3.
Intratumoral injection of heat-iOV-GM induces higher levels of activated CD8+ and CD4+ T cells in the non-injected distant tumors. (A) B16-F10 melanoma cells were intradermally implanted into the left and right flanks of mice (2.5 x 10⁵ and 5 x 10⁵ cells, respectively). PBS, OV, live OV-GM, or heat-iOV-GM (2 x 10⁷ pfu) were injected IT into the right-side tumors on day 8 and day 11 after tumor implantation. Tumors were harvested 3 days post last virus injection and were analyzed for immune cell infiltration by FACS. (B) Representative flow cytometry plot of CD8+ T cells expressing Granzyme B in the non-injected or injected tumors from mice treated with PBS, OV, live OV-GM, or heat-iOV-GM. (C) Percentages of CD8+ T cells expressing Granzyme B within non-injected and injected tumors. (D) Representative flow cytometry plot of CD4+ T cells expressing Granzyme B in the non-injected and injected tumors from mice treated with PBS, OV, live OV-GM, or heat-iOV-GM. (E) Percentages of CD4+ T cells expressing Granzyme B within non-injected and injected tumors (n=5, *P < 0.05; **P < 0.01; ***P < 0.001; ****P < 0.0001) (F-I) CD8+ T cells from splenocytes of mice treated with different viruses were analyzed for anti-tumor interferon-γ (IFN-γ+) T cells using ELISPOT assay. (F) IFN-γ+ spots per 250,000 purified CD8+ T cells from the spleens of the mice treated with IT PBS, OV, live OV-GM, or heat-iOV-GM (n=5, *P < 0.05; **P < 0.01). (G) Representative images from an ELISPOT assay from (F). (H) IFN-γ+ spots per 250,000 purified CD8+ T cells from WT, Batf3-/-, or STINGGt/Gt mice treated with IT heat-iOV-GM. (I) ELISPOT images from pooled CD8+ T cells of WT, Batf3-/-, or STINGGt/Gt mice treated with IT heat-iOV-GM from (H). (n=3, *P < 0.05; **P < 0.01; ***P < 0.001; ****P < 0.0001).

