. 2021 Jul 27;301(1):211–220. doi: 10.1148/radiol.2021204149

Figure 5:

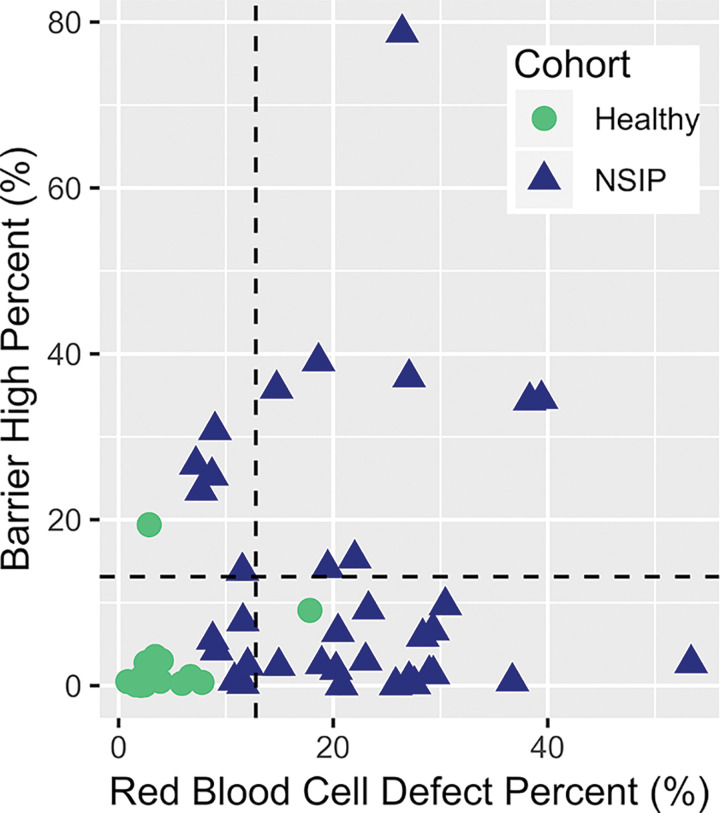
Scatterplot shows distribution of high barrier uptake percentage and red blood cell defect percentage in participants with nonspecific interstitial pneumonia (NSIP) (triangles) and healthy control participants (circles). High barrier uptake percentage for the observed 95th percentile in healthy control participants (12.7%) and red blood cell defect percentage for the observed 95th percentile in healthy control participants (12.8%) are indicated by dashed lines.

Scatterplot shows distribution of high barrier uptake percentage and red blood cell defect percentage in participants with nonspecific interstitial pneumonia (NSIP) (triangles) and healthy control participants (circles). High barrier uptake percentage for the observed 95th percentile in healthy control participants (12.7%) and red blood cell defect percentage for the observed 95th percentile in healthy control participants (12.8%) are indicated by dashed lines.