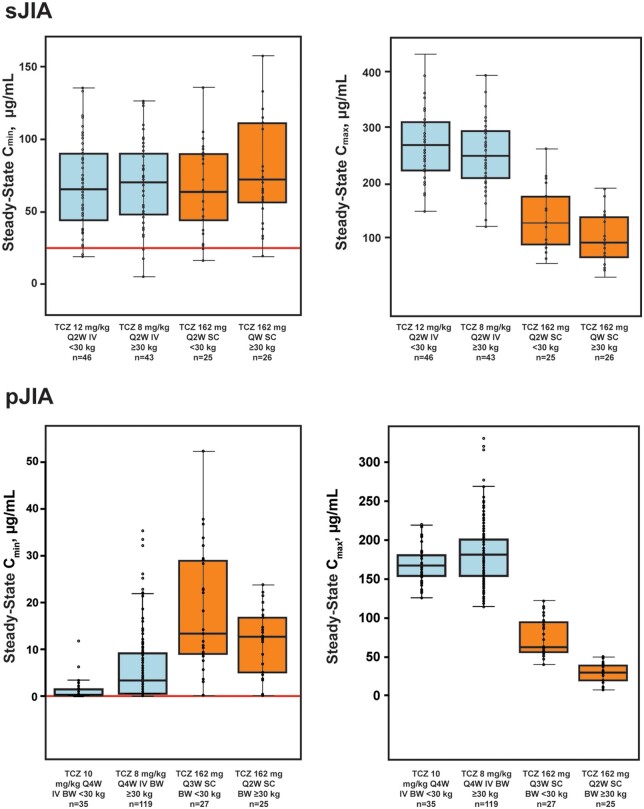
Fig. 2.
Model-computed median steady-state Cmin and Cmax from s.c. dosing vs i.v. dosing
Median values are designated by black lines in the centres of the boxes. Boxes indicate the IQR. Whiskers represent 1.5 × IQR. Horizontal red line denotes the model-computed 5th percentile from the i.v.-TCZ trials. The number of i.v.-TCZ sJIA patients includes all patients randomly assigned to TCZ in part 1 of the i.v.-TCZ trial and any patient who escaped from placebo to TCZ in part 1 for whom a PK sample was available. BW: body weight; Cmax: maximum concentration; Cmin: minimum concentration; IQR: interquartile range; PK: pharmacokinetic; QW: every week; Q2W: every 2 weeks; Q3W: every 3 weeks; TCZ: tocilizumab; sJIA: systemic JIA.

