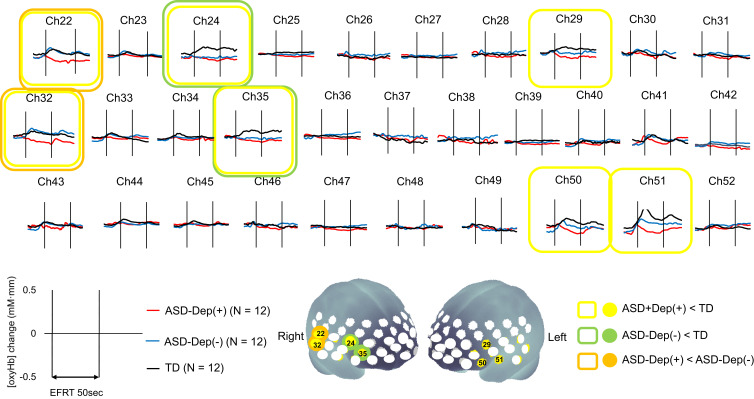
Figure 2.
The grand-averaged waveforms of oxygenated hemoglobin concentration ([oxy-Hb]) changes.
Notes: The images in the upper part of the figure show the grand-averaged waveforms of [oxy-Hb] changes during the emotional face recognition task (EFRT) in autism spectrum disorder (ASD) with comorbid depression (red), ASD without depression (blue), and typical development (TD) (black) participants. In the brain mapping images in the lower part of the figure, colored circles indicate the significant channels in one-way ANOVA (false discovery rate-corrected p < 0.05). In addition, the results of multiple comparisons are shown as follows: yellow circle, ASD with depression < TD; green circle, ASD without depression < TD; orange circle, ASD with depression < ASD without depression.

