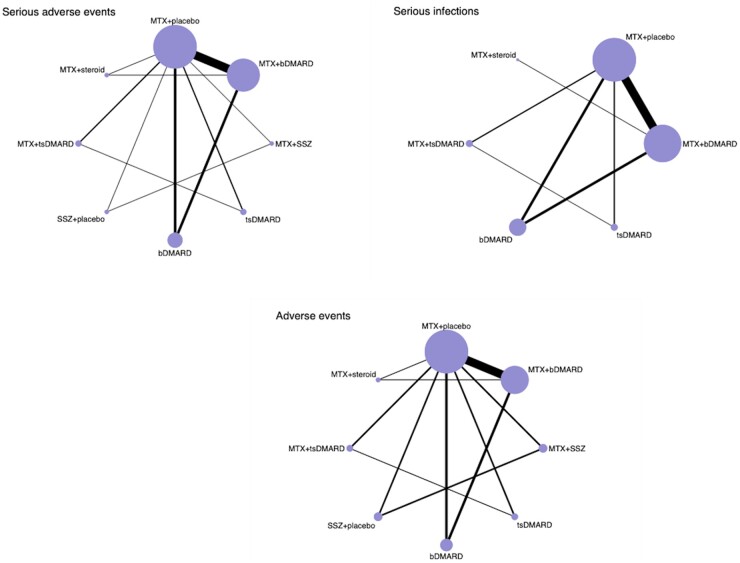
Fig. 2.
Network plot of comparison of treatment strategies
Network plots of comparison of treatment strategies with respect to serious adverse events, serious infections and adverse events (non-serious adverse events) in patients with RA. The size of the circles is proportional to the number of patients in each arm. The line widths are proportional to the number of studies in the comparison. bDMARD: biologic DMARD; tsDMARD: targeted synthetic DMARD.

