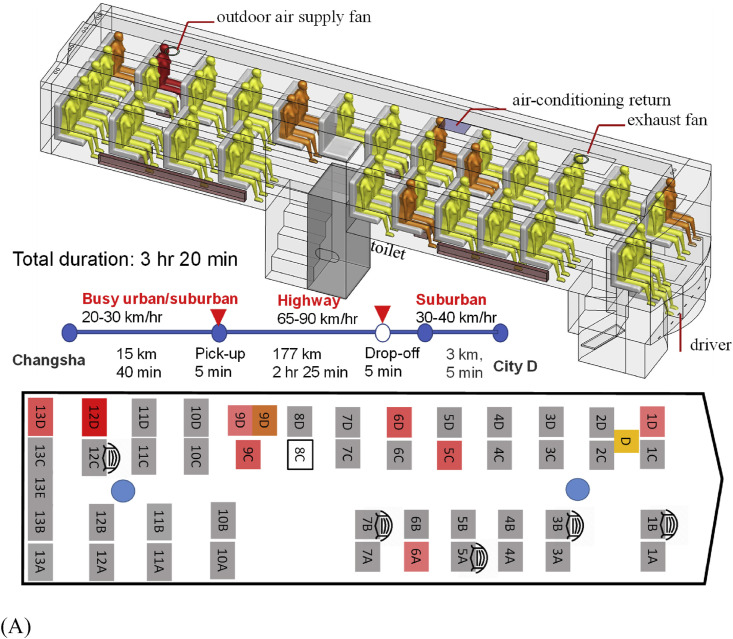
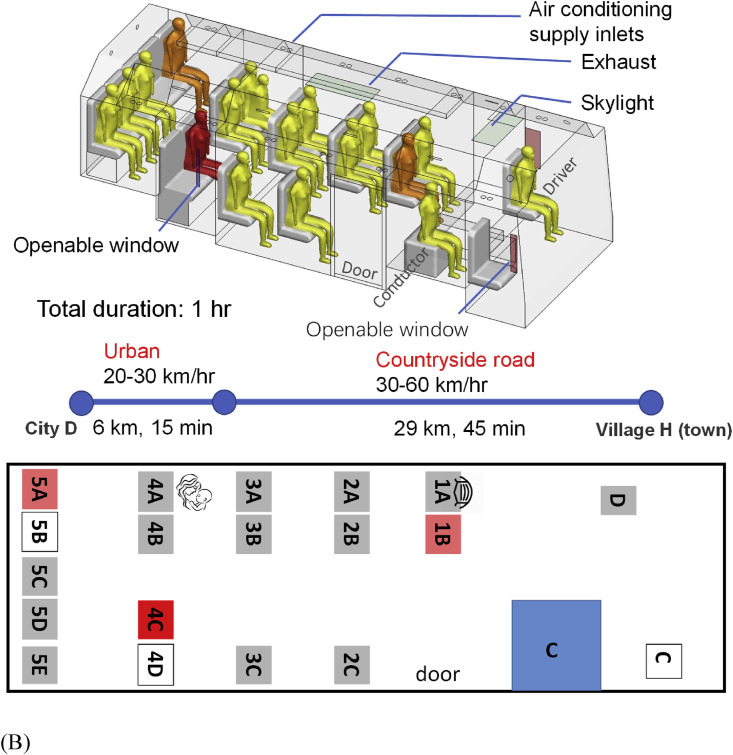
Fig. 1.
(Color Online) The two buses, seating plans, journeys, and distribution of confirmed cases of SARS-CoV-2 infection by seat numbers. (A) bus B1; (B) bus B2. The seat numbering has been assigned by the authors. Seat D is where the driver sat, and Seat C on B2 was reserved for the bus conductor, although she actually sat in the luggage area during the journey. The seat number in deep red on each seating plan indicates the possible location of the index case. Seat numbers in light red indicate where the infected individuals sat. The duration and journey length of each route are also shown. The passenger in seat 9D on B1 from Changsha to city D was infected, and the passenger in the same seat on the return trip from city D to Changsha also became infected (shown in brown with a separate seat symbol). Seats with a mask means the corresponding passengers wore a facial mask and seat 4A on bus B2 is where the passenger carrying a child sat on that day. (For interpretation of the references to colour in this figure legend, the reader is referred to the Web version of this article.)


