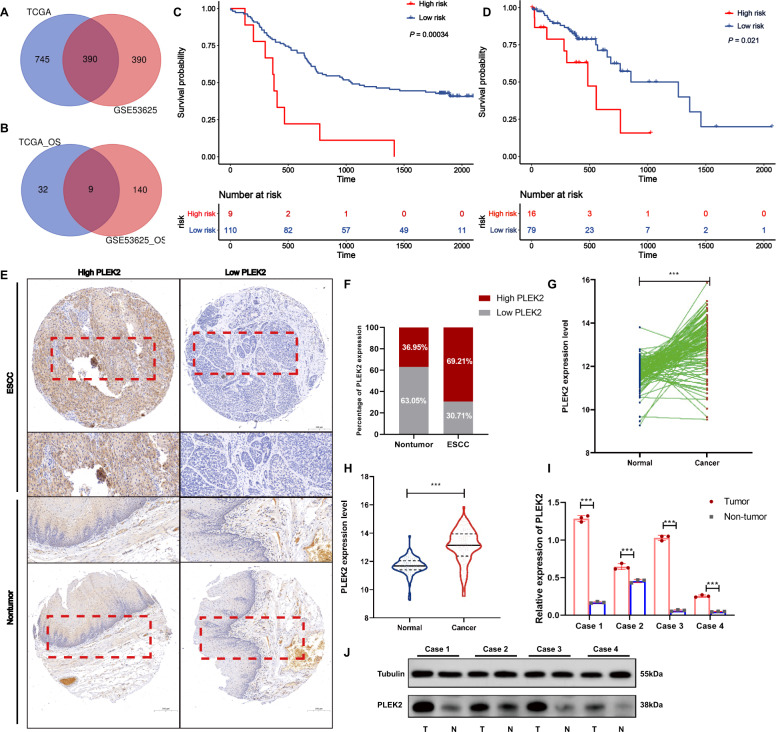
Fig. 1. PLEK2 is overexpressed in ESCC and associated with prognosis.
A Venn diagram of common differentially expressed genes in the TCGA and GSSE53625; B Venn diagram of common genes which were related to OS in the TCGA and GSSE53625; C Kaplan–Meier plots of OS of patients with ESCC in GSE53625, P = 0.00034; D Kaplan–Meier plots of OS of patients with ESCC in TCGA database, P = 0.021; E PLEK2 expression in a human ESCC tissue microarray. Representative microscopic images of benign and ESCC tissues stained with an antihuman PLEK2 antibody; F Bar chart summary of the distribution of PLEK2 expression levels in nontumor versus ESCC by IHC (n = 100 total cases; *P < 0.05); G The expression of PLEK2 in tumour tissues and nontumor tissues in the GSE53625 database when the data were not paired, ***P < 0.001; H The expression of PLEK2 in tumour tissues and nontumor tissues in the GSE53625 database when the data were paired, ***P < 0.001; I Relative expression of PLEK2 in fresh tumour tissues and adjacent normal tissues from four ESCC patients detected by Western Blot. ***P < 0.001; J Expression of PLEK2 in fresh tumour tissues and adjacent normal tissues from four ESCC patients detected by Western Blot. Tubulin was used as loading control.

