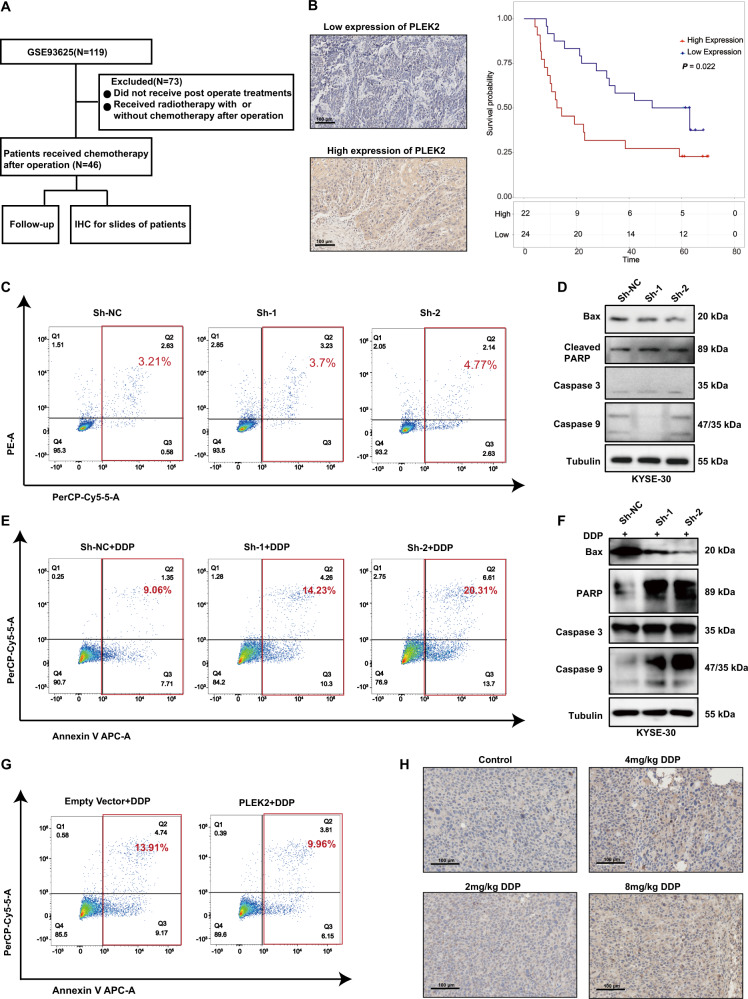
Fig. 4. PLEK2 linked to chemo-resistance of ESCC cell lines.
A The scheme of process of choosing patients; B Representative images of high and low expression of PLEK2 (left) and Kaplan-Meier plots of OS of patients who received chemotherapy in the database GSE53625 (right); C The apoptosis rate of PLEK2 stably knockdown KYSE-30 cells; D Western blot analysis of markers of cell apoptosis including Bax, Cleaved PARP, Caspase 3 and Caspase 9. Tubulin was used as loading control; E The apoptosis rate of PLEK2 stably knockdown KYSE-30 cells after the treatment of DDP for 24 h; F Western blot analysis of markers of cell apoptosis; G The apoptosis rate of KYSE-30 with PLEK2 stably overexpressed after the treatment of DDP for 24 h; H Representative images of IHC in KYSE-30 xenograft tumours treated with varying dosage of DDP.

