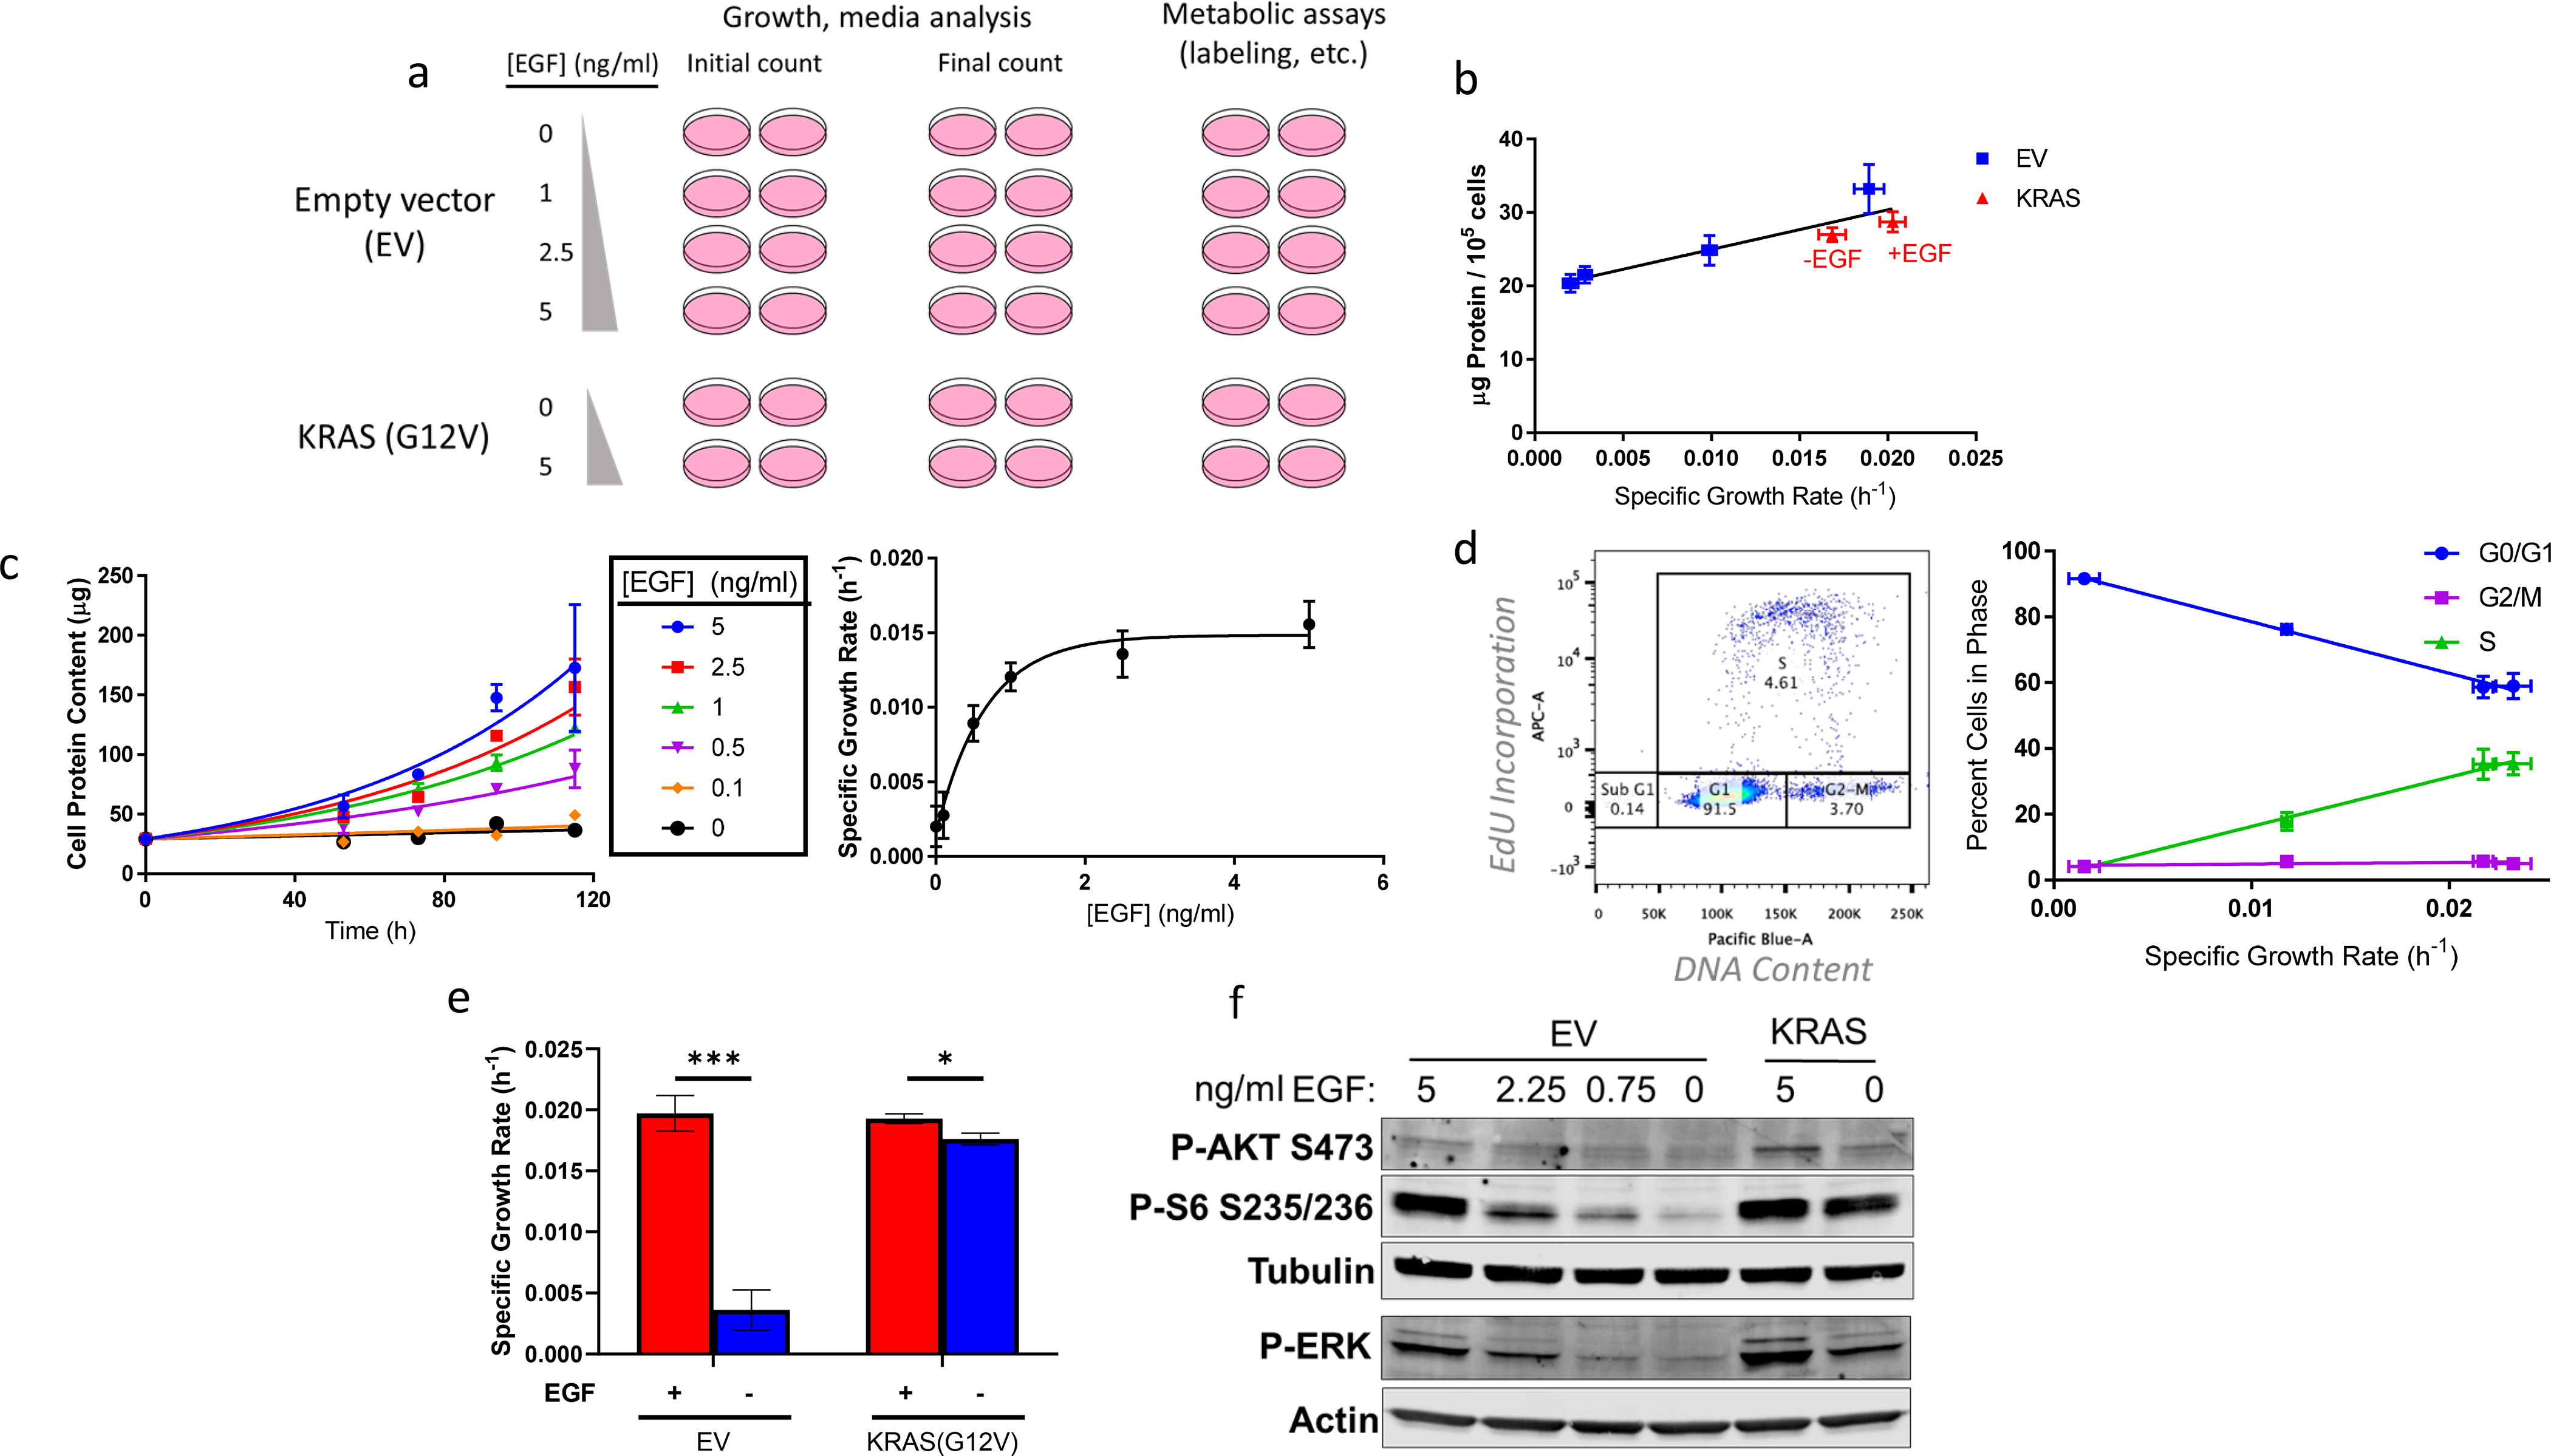
Figure 1. Cell culture system for distinguishing EGF- and oncogenic KRAS-stimulated metabolism.

a, Schematic representing the workflow for this investigation. Experiments include plates corresponding to initial and final counts (assessed through quantifying total cellular protein content) to determine growth rate and extracellular fluxes and additional plates grown in parallel for other metabolic assays. EV-HMECs were incubated in four EGF concentrations to vary growth rate and KRAS-HMECs were incubated in 0 and 5 ng/ml EGF.
b, Protein content per cell vs. growth rate for EGF-titrated EV-HMECs and KRAS-HMECs cultured in 5 ng/ml EGF (+EGF) and 0 ng/ml EGF (−EGF).
c, (left) Growth curves of EV-HMECs treated with varying concentrations with EGF and (right) estimated specific growth rate as a function of EGF concentration.
d, (left) Percent of cells in cell cycle phase, as assessed by flow cytometry, as a function of growth rate and (right) ratio of G0/G1 to G2/M/S phase EGF-titrated EV-HMECs as a function of growth rate.
e, Specific growth rates for EV-HMECs and KRAS-HMECs under 5 ng/ml EGF (+EGF) and 0 ng/ml EGF (−EGF).
f. Western blot representing phospho-Akt (S473), phospho-S6 (S235/236), and phospho-ERK with tubulin and actin loading controls for EV- and KRAS-HMECs under a range of EGF concentrations.
For b, error bars represent mean ± SD for n = 3 wells; a single experiment was performed. For c, error bars indicate mean ± SD for cell counts, with n = 2 wells per time point (10 wells per each condition in total), and 95% confidence intervals for growth rates. Results are representative of three replicate experiments. For d, error bars indicate mean ± SD for n =3 wells; a single experiment was performed. For e, error bars represent mean ± SD for n = 3 wells, and results are representative of more than three replicate experiments. * p < 0.05, ** p < 0.01, *** p < 0.001 (Multiple t-test with adjusted p-value). For f, a single experiment was performed.
