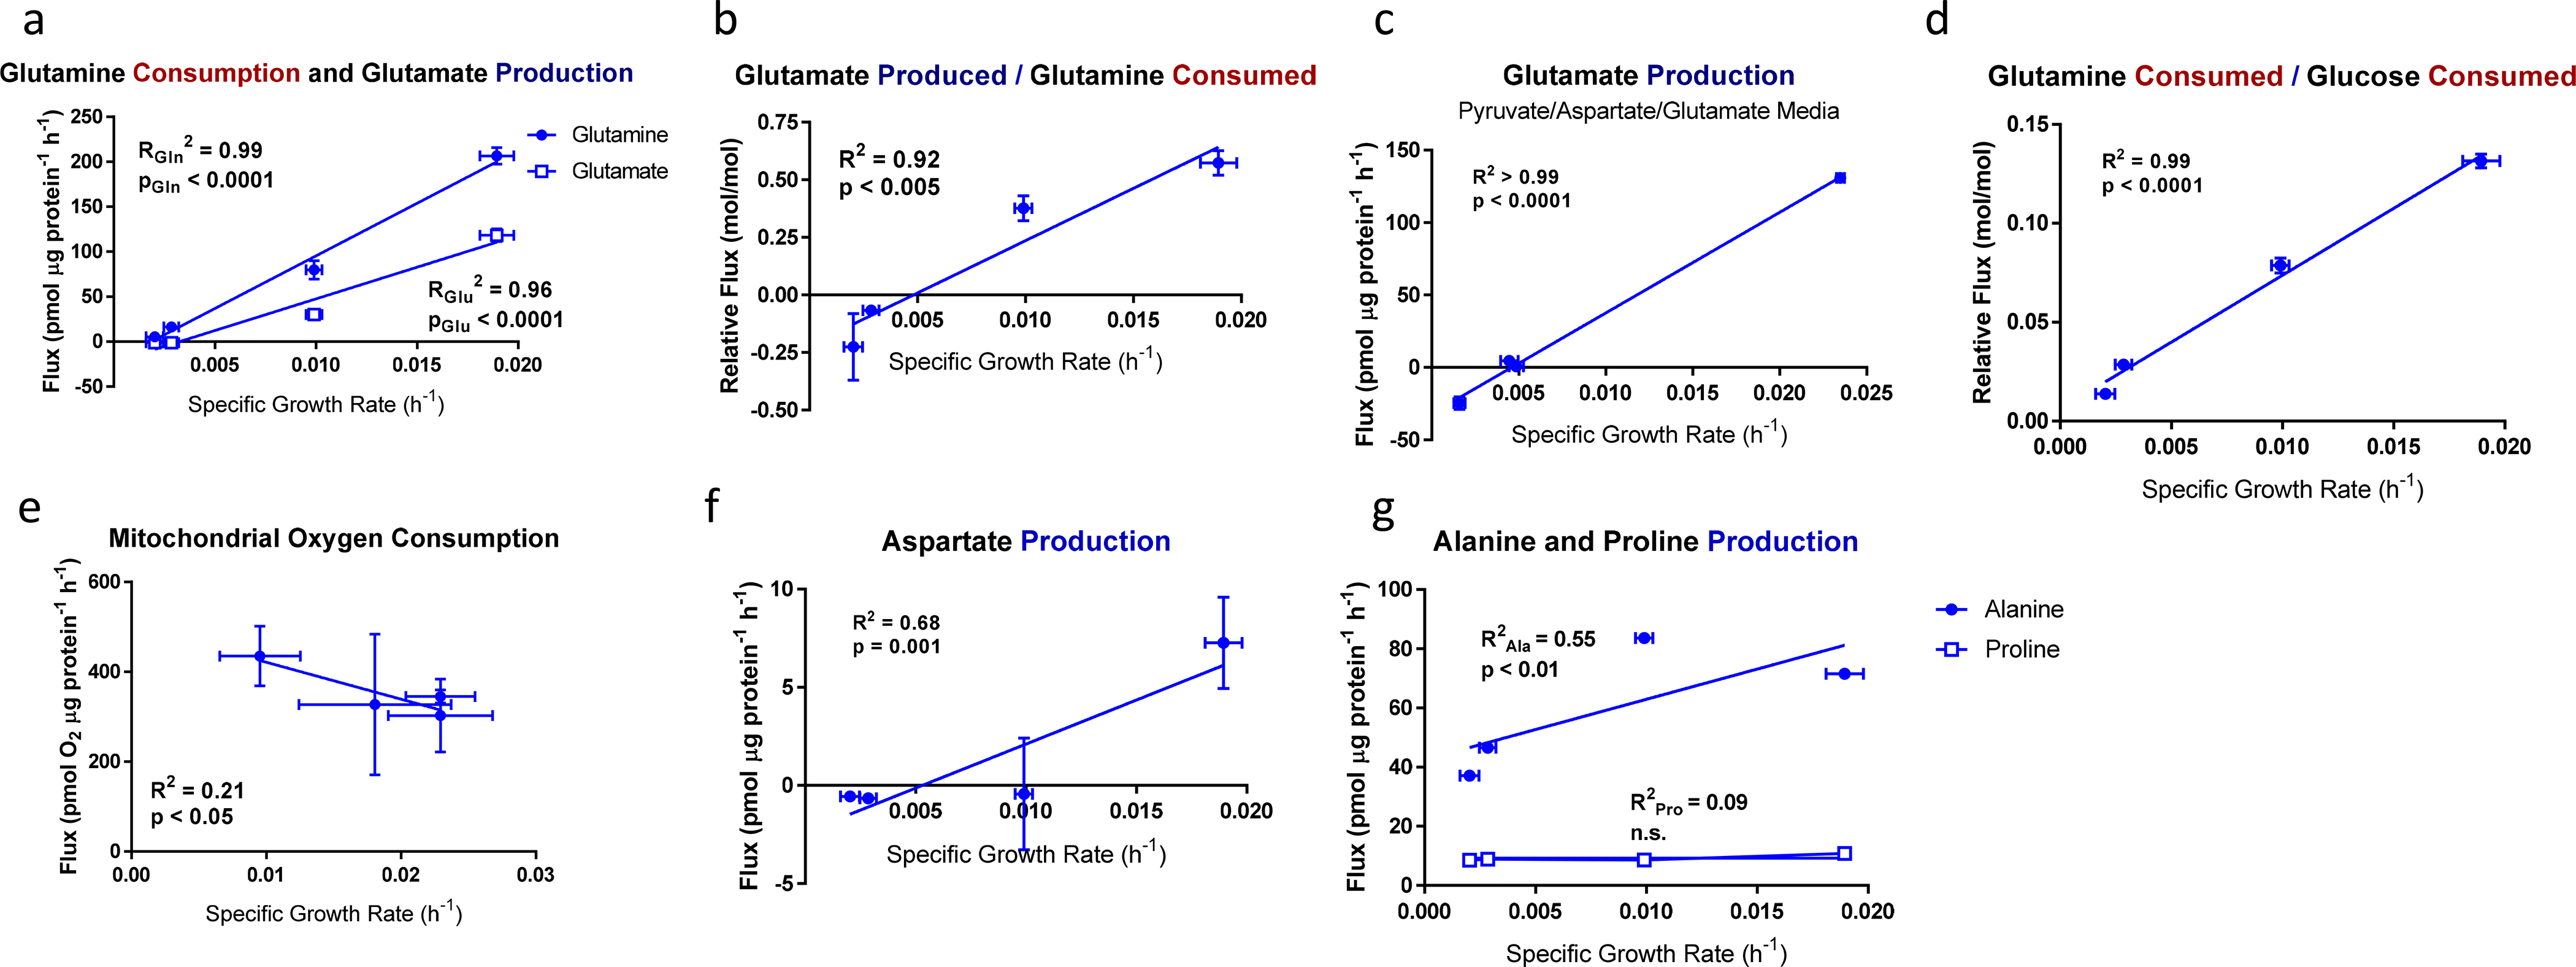
Figure 3. Glutamine- and TCA cycle-associated fluxes in EGF-titrated EV-HMECs.

a, Glutamine consumption and glutamate production; b, glutamate produced per glutamine consumed; c, Glutamate production in medium supplemented with glutamate, aspartate, and pyruvate; d, glutamine consumed per glucose consumed; e, mitochondrial oxygen consumption f, aspartate production; and g, alanine and proline production as functions of specific growth rate for EV-HMECs under variable concentrations of EGF.
For a-b, d, and f-g, error bars represent mean ± SD for n = 3 wells, and results are representative of three replicate experiments. For c, error bars represent ± SD for n = 3 wells; a single experiment was performed. For e, error bars represent mean ± SD for n = 5 wells; a single experiment was performed. P-values reflect the likelihood that the regression line slopes differ from zero and were determined using the extra sum-of-squares F-test.
