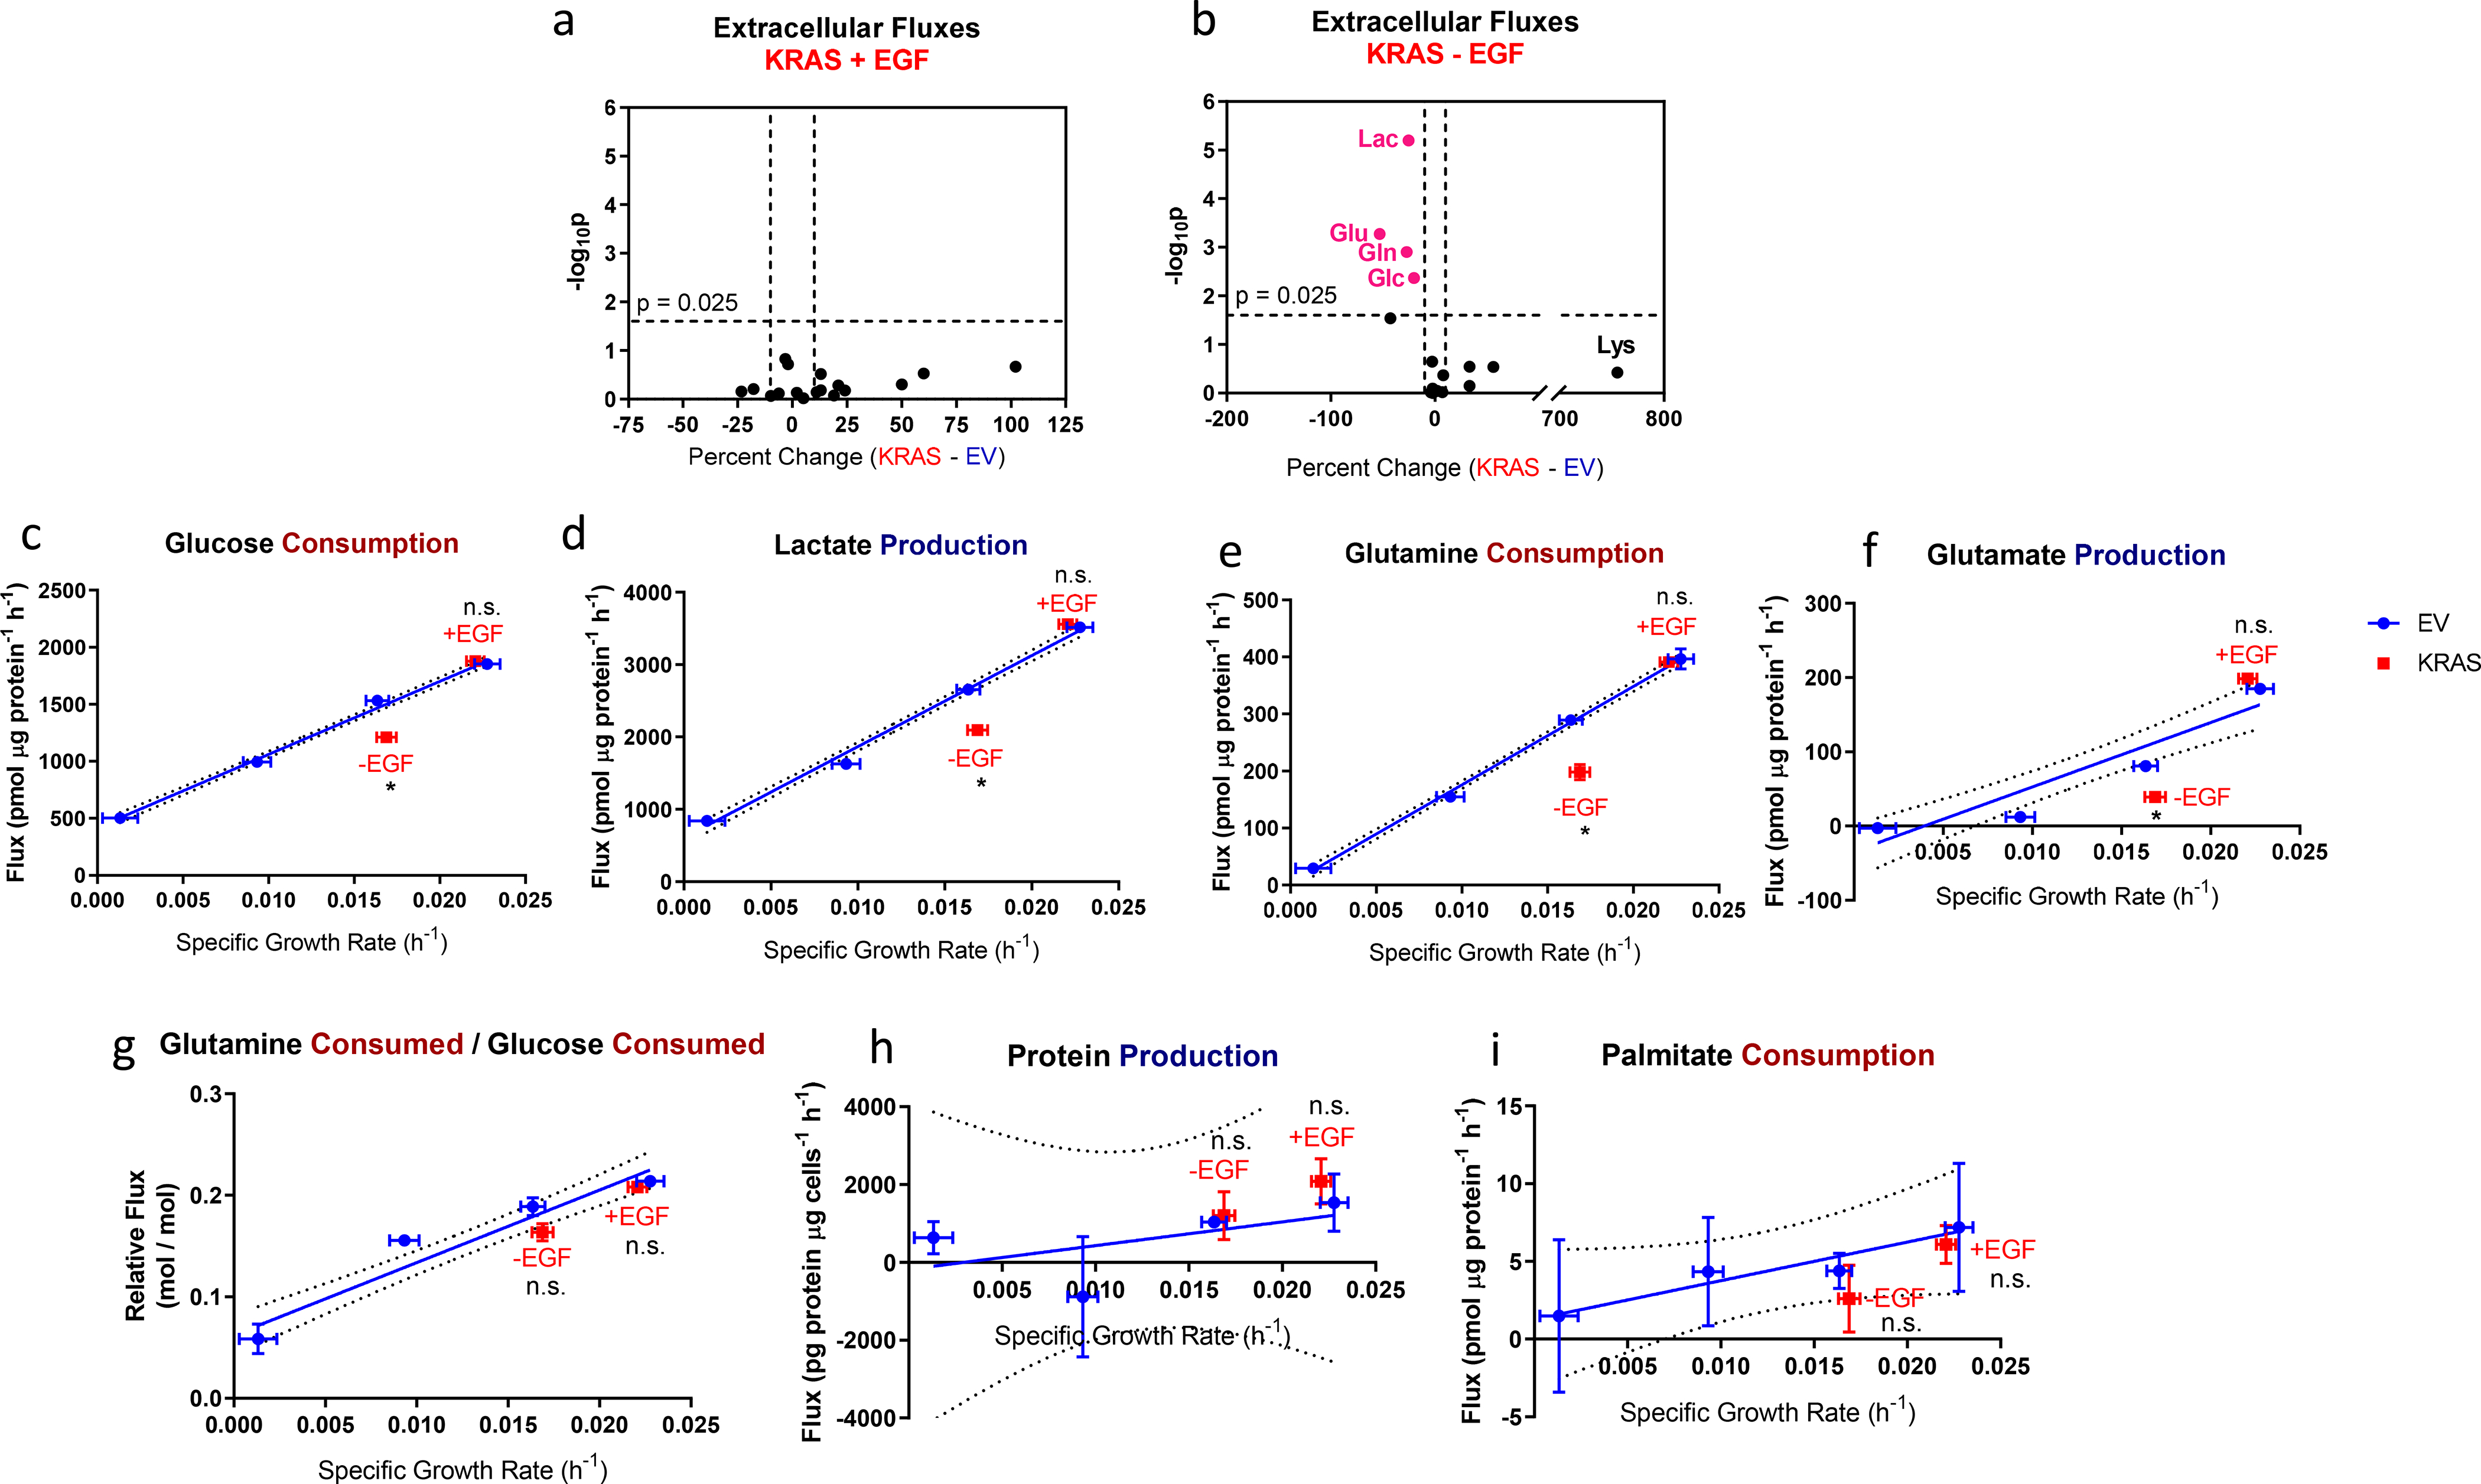
Figure 7. Comparison of metabolic fluxes in EV- and KRAS-HMECs.

a-b. Volcano plots of extracellular fluxes from KRAS-HMECs cultured in a, 5 ng/ml EGF and b, 0 ng/ml EGF showing percent change and statistical significance of differences from growth-based trends in EV-HMECs. Values in pink indicate where statistical significance and magnitude difference thresholds are exceeded.
c-f. c, Glucose consumption, d, lactate production, e, glutamine consumption, and f, glutamate production vs. growth rate for EGF-titrated EV-HMECs and KRAS-HMECs cultured in 5 ng/ml EGF (+EGF) and 0 ng/ml EGF (−EGF).
g. Glutamine consumed per glucose consumed vs. growth rate for EGF-titrated EV-HMECs and KRAS-HMECs cultured in 5 ng/ml EGF (+EGF) and 0 ng/ml EGF (−EGF).
h-i. h, Net protein production and i, palmitate consumption vs. growth rate for EGF-titrated EV-HMECs and KRAS-HMECs cultured in 5 ng/ml EGF (+EGF) and 0 ng/ml EGF (−EGF).
Error bars in c-f represent mean ± SD for n = 2 or 3 wells. Results are representative of three replicate experiments. In g, error bars represent ± SD for n = 2 or 3 wells; results are representative of three replicate experiments. In h-i, error bars represent ± SD for n = 2 wells. A single experiment was performed for each. n.s., not significant, p < 0.025 (Outlier shift model).
