
Figure 4. HP suppresses proinflammatory pathways and preserves NAD+ levels in the post-ischemic kidney to promote favorable metabolic reprogramming.
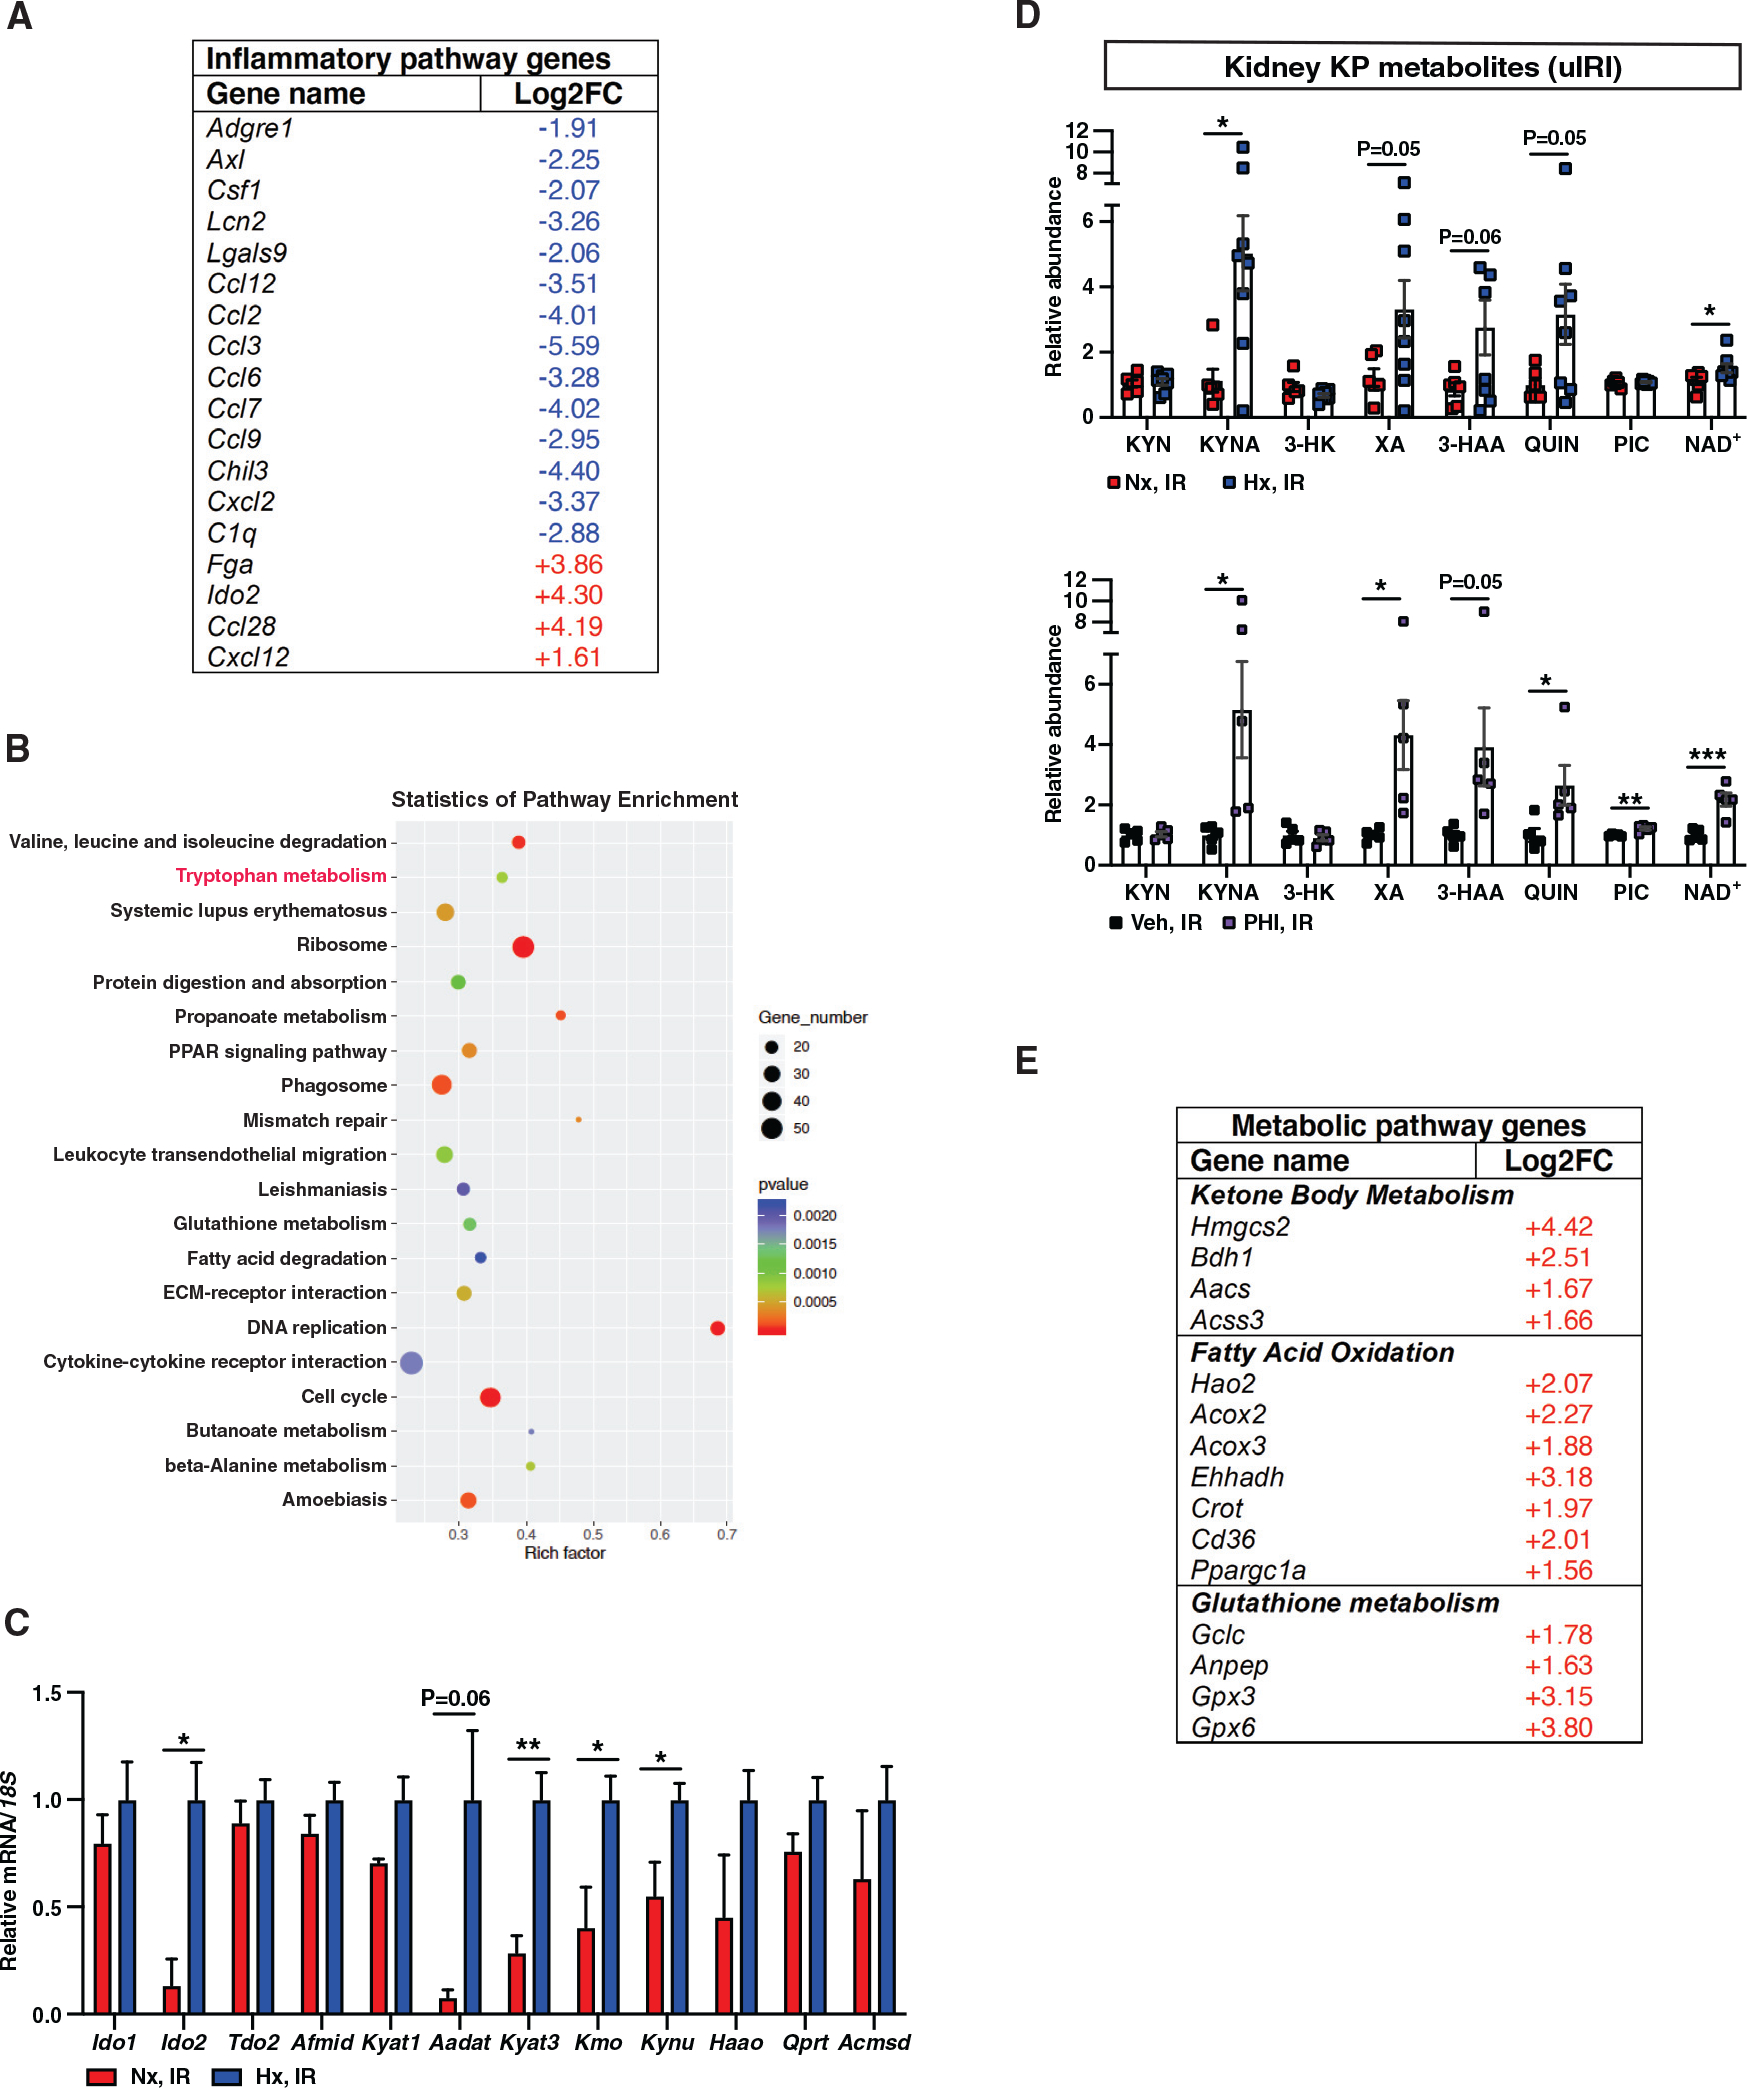
(A) Shown is a list of selected genes with ontologies of inflammatory response and immune system process among DEGs in response to HP with a log2FC greater than 1 or less than −1 and false discovery rate (FDR)-adjusted p < 0.05.
(B) KEGG enrichment graph displays the top 20 pathways. The number of DEGs enriched in KEGG terms, p value, and rich factor are shown in scatterplot. Rich factor = (number of DEGs in KEGG term)/(total number of genes in KEGG term).
(C and D) Relative mRNA levels of genes associated with tryptophan metabolism (n = 3 [Nx, IR] and 4 [Hx, IR]) (C) and KP metabolites (D) in day 3 post-IRI kidneys from mice subjected to HP (upper panel) compared to normoxia (n = 6 [Nx, IR] and 8 [Hx, IR]) or PHI-treated mice compared to vehicle (n = 5) (lower panel).
(E) List of selected metabolic pathway genes among DEGs in response to HP with FDR-adjusted p < 0.05.
Error bars represent SEM. For (C) and (D), statistics were determined by two-tailed t test; *p < 0.05. Afmid, arylformamidase; Kyat, kynurenine aminotransferase; Aadat, aminoadipate aminotransferase; Kmo, kynurenine 3-monooxygenase; Kynu, kynurerinase; Haao, 3-hydroxyanthranilate 3,4-dioxygenase; Qprt, quinolinate phosphoribosyltransferase; Acmsd, alpha-amino-beta-carboxy-muconate-semialdehyde decarboxylase. KYN, kynurenine; KYNA, kynurenic acid; 3-HK, 3-hydroxykynurenine; XA, xanthurenic acid; 3-HAA, 3-hydroxyanthranilic acid; QUIN; quinolinic acid, PIC; picolinic acid.