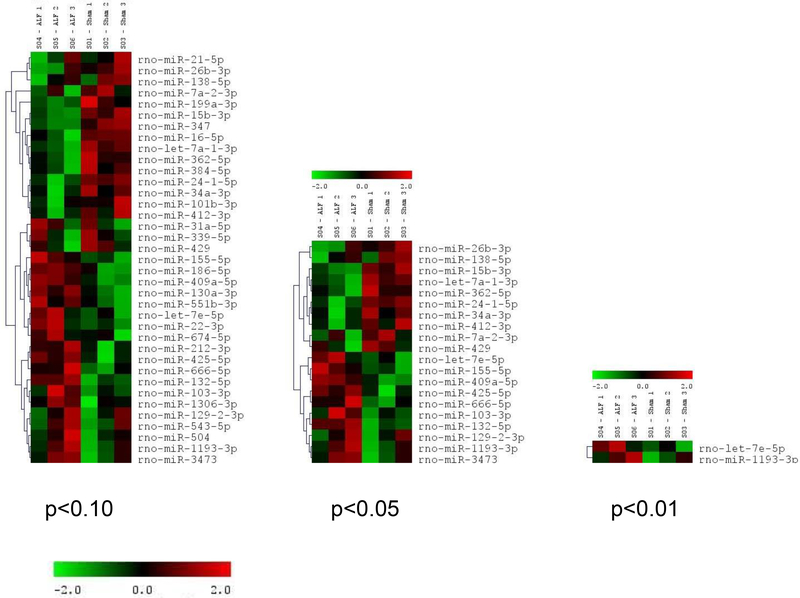
Fig. 2:
Hierarchical clustering of the miRNAs altered after ALF in comparison to sham controls (n=3 microarrays/group). The figure shows the miRNAs altered in the ALF group at 3 different statistically significant levels (p<0.01, p<0.05 and p<0.10). In the ALF group 37 miRNAs were observed to be significantly altered compared to sham (20 miRNAs were up-regulated and 17 miRNAs were down-regulated). The color code in the heat maps is linear with green as the lowest and red as the highest. The miRNAs that were increased in expression were shown in green to red while the miRNAs that were decreased in expression were shown from red to green. The individual expression signal of each miRNA in each array was clustered using Euclidean distance function. The dendrograms (tree diagrams) show the grouping of miRNAs according to the order in which they were joined during the clustering. The miRNAs with most similar expression patters were placed next to each other.

