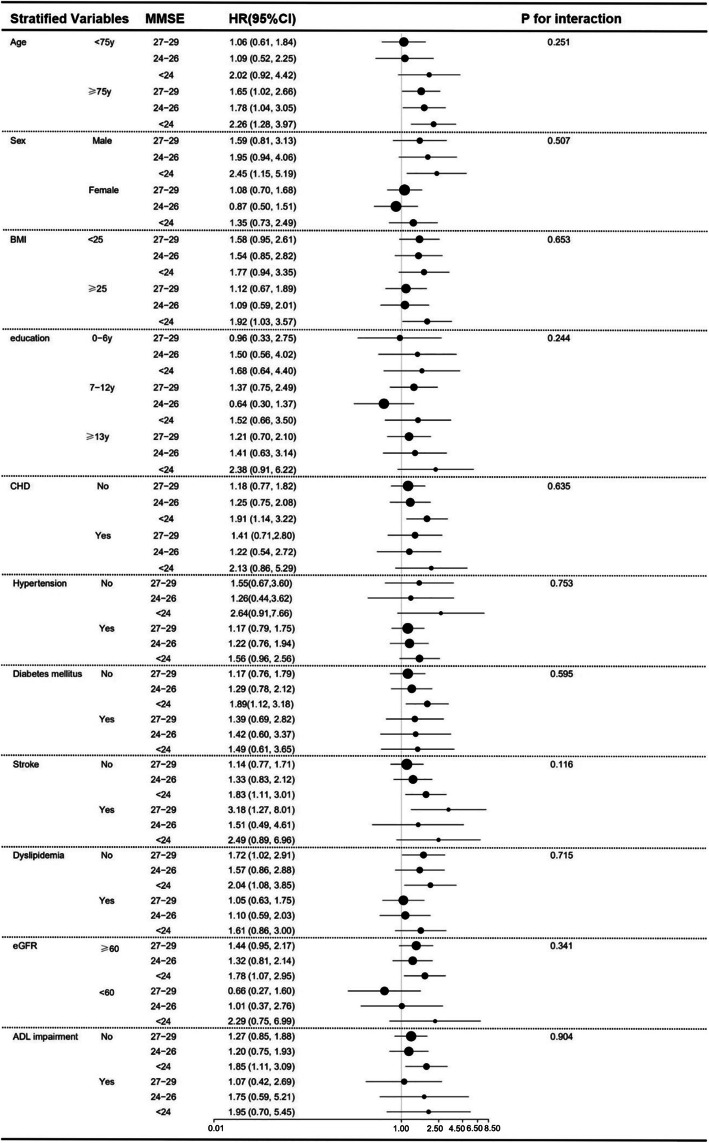
Fig. 2.
Subgroup analyses for the association between all-cause mortality and baseline MMSE categories. Adjusted for age, sex, BMI, waistline, SBP, DBP, FPG, TC, HDL, LDL, TG, eGFR, education level, marital status, smoking status, drinking status, CHD, hypertension, diabetes mellitus, stroke, family history of dementia, dyslipidemia, antiplatelet agents, antihypertensive agents, hypoglycemic therapy, lipid-lowering therapy, and ADL impairment except for the stratified variable

