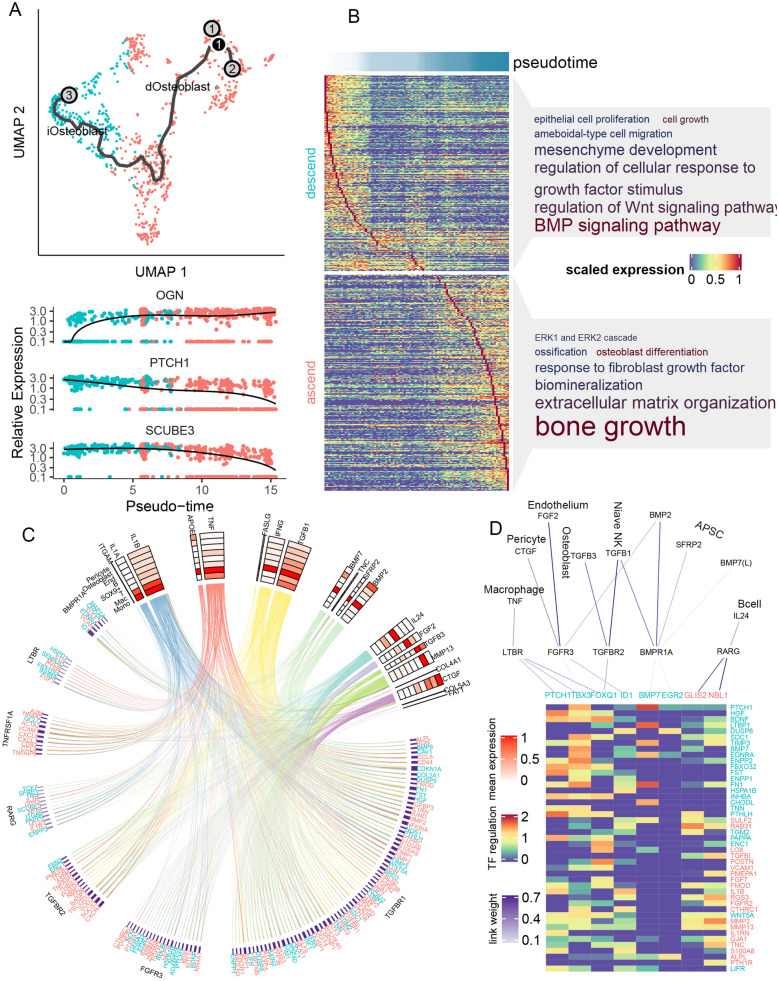
Fig. 4.
Intercellular signaling network regulating osteoblast differentiation. A Pseudotime analysis of osteoblast. Lower panel showed the expression trajectory along pseudotime for three genes as example. B GO-BP analysis of gene significantly altered along pseudotime. Font size showed the fold of enrichment of the pathway, and color showed the log p value of enrichment. C Circus plot of the signaling network. Upper part showed the ligands and their average expression in each cell types (red-scale heatmap). Lower part showed the target genes, and a line linking one ligand and one target indicated the regulation potentiality between them (predicted by NicheNet). Color of lines corresponded to the cell type with the highest ligand expression (color scales same as Fig. 1B). Targets are grouped according to their predicted upstream receptor (receptor names showed at the outer layer). Purple color bar indicated the predicted ligand-receptor association weight. D Transcription factors (TF) involved in osteoblast differentiation. From top to down: ligands from each cell types; receptors on the surface of osteoblast; transcription factor within osteoblast; regulation potentiality of TF on target genes

