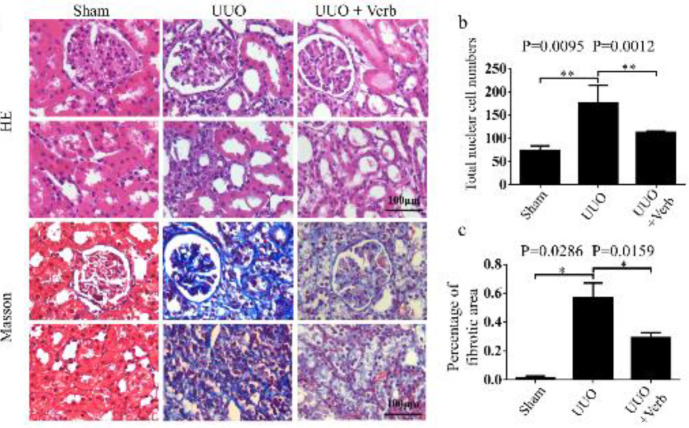
Figure 3.
Renal histopathology change in all groups. (a) Paraffin sections of kidney tissues from sham/UUO model/ UUO + Verb rats were stained with H&E and Masson's trichrome. Original magnification, 400×. Scale bars, 100 μm. (b) Bar graph of the total nuclear cell calculated by HE staining. (c) Percentage of the fibrotic area by Masson's trichrome staining. All values are presented as SEM. n=6 or 7 rats in each group. Mann-Whitney U test was used for single two-sample comparisons. Verb: verbascoside. *P<0.05;, **P<0.01

