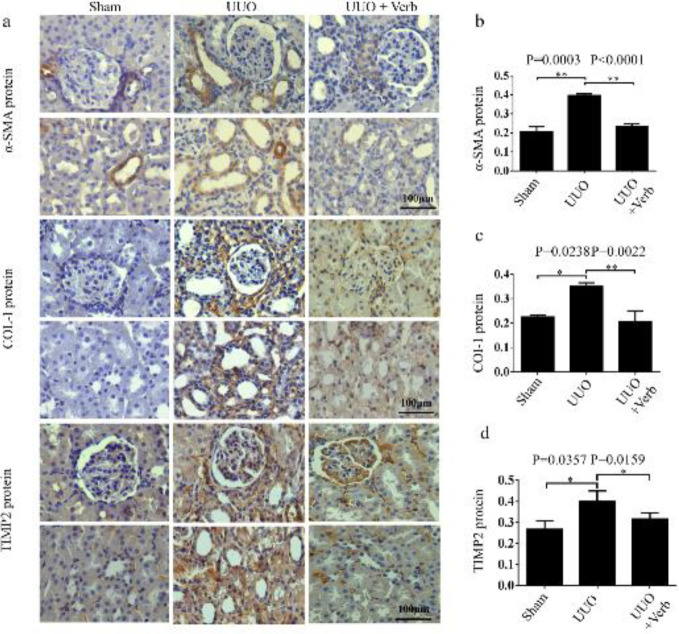
Figure 5.
α-SMA, COL-I, and TIMP2 protein levels in the kidney of different experimental groups. (a) Expression of α-SMA, COL-I, and TIMP2 protein by immunohistochemistry. Original magnification, 400×. Scale bars, 100 μm. (b) Bar graph of α-SMA protein expression level. (c) Bar graph of COL-I protein expression level. (d) Bar graph of TIMP2 protein expression level. All values are presented as SEM. n=6 or 7 rats per group. Two-tailed student’sStudent’s t-test was used for single two-sample comparisons of α-SMA protein and the Mann-Whitney U test was used for two-group comparisons of COL-I and TIMP2 proteins. Verb: verbascoside. *P<0.05;, **P<0.01

