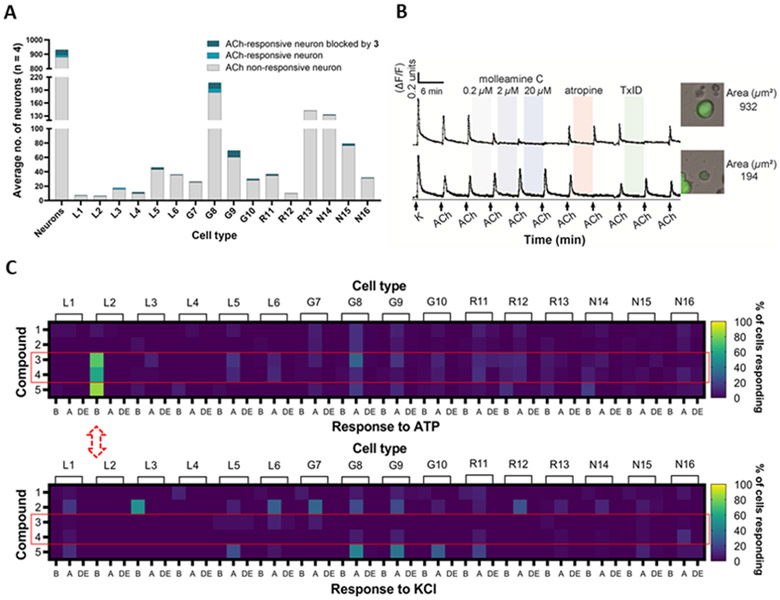
Figure 3.
Constellation pharmacology of compounds 1-5 in DRG neurons. Descriptors L1-6, G7-10, R11-13, and N14-16 refer to neuronal cell types found in the DRG,16, 27 but importantly for this figure, G8 and G9 cells comprise pain sensors (PNs), while L2 cells are light touch-responsive Aδ-LTMRs. A) and B) Molleamine C (3) is a nAChR antagonist. Compound 3 (0.2-20 μM) was applied in experiments (n = 4) using ACh (1 mM), with an average of ~900 neurons observed per experiment. A) Average number of neurons with ACh response blocked by 3 (20 μM). The y-axis shows the average number of neurons, while the x-axis indicates neuronal cell type. B) Representative individual DRG neurons responding to ACh (1 mM). The y-axis indicates intracellular [Ca2+], reflected in the normalized min/max fluorescence ratio of 340 nM/380 nM from the Fura-2-AM Ca2+ indicator. The x-axis is time (min), where ACh (1 mM) is repeatedly pulsed (arrows), with incubation of increasing concentrations of compound 3, muscarinic receptor antagonist atropine (0.5 μM), and peptide nAChR antagonist TxID (1 μM). Inset figures show the bright-field image of the corresponding cell (cross-sectional area in μm2). C) Compounds 3-4 selectively block ATP activation in Aδ-LTMRs, while response to KCl is unaffected. Compounds (applied at 20 μM) are in the y-axis, while the x-axis is activity observed in each cell type: amplification (A) of the response to ATP or KCl; blocking (B) of the response to ATP or KCl; and direct effects (DE), in which compounds directly depolarize cells.

