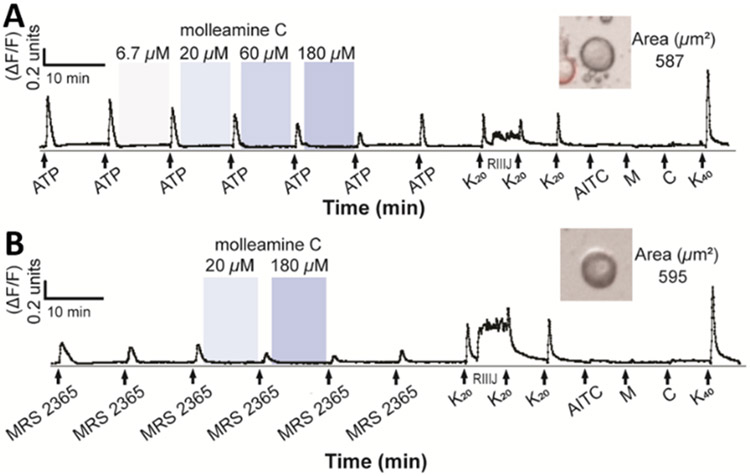
Figure 6.
Compound 3 inhibits P2Y1-mediated responses in Aδ-LTMR DRG neurons. The y-axis indicates intracellular [Ca2+], reflected in the normalized min/max fluorescence ratio of 340 nM/380 nM from the Fura-2-AM Ca2+ indicator. The x-axis is time (min), where A) ATP (20 μM) or B) MRS 2365 (100 nM) activation is opposed by addition of (from 6.7 to 180 μM). Ligands used to differentiate cell types (K20, potassium chloride (20 mM); RIIIJ (1 μM); AITC (100 μM); M, menthol (400 μM); C, capsaicin (500 nM); K40, potassium chloride (40 mM)) are added at the end of the experiment. Inset figures show the bright-field image of the corresponding cell (cross-sectional area in μm2).

