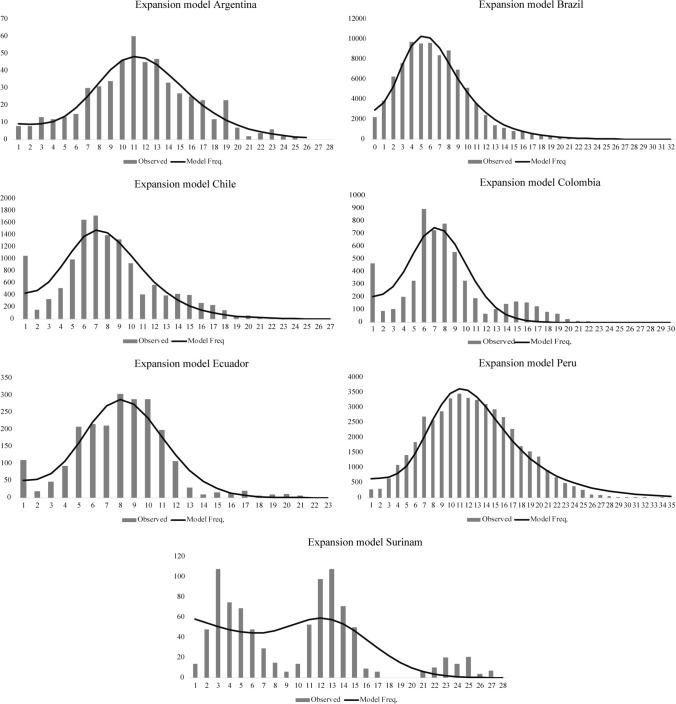
Fig. 3.
Mismatch distribution for the pure demographic expansion model. Frequency distributions of the observed number of pairwise nucleotide differences between haplotypes for seven South American countries are shown. The solid line is the theoretical distribution under the assumption of pure demographic expansion.

