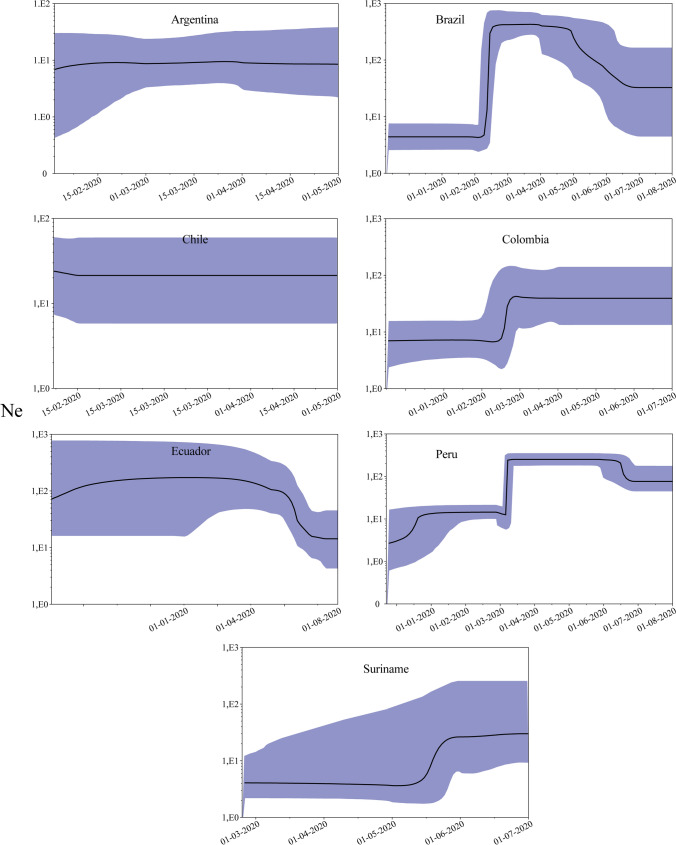
Fig. 5.
Bayesian skyline plot (BSP) of the SARS‐CoV‐2 outbreak. BSP assessed changes in effective population size (Ne) in seven South American countries. The y‐axis indicates Ne, and the x‐axis shows the time in days/months. The solid black line represents the estimated median value, and the blue shades indicate the 95% highest posterior density.

