
Fig. 4.
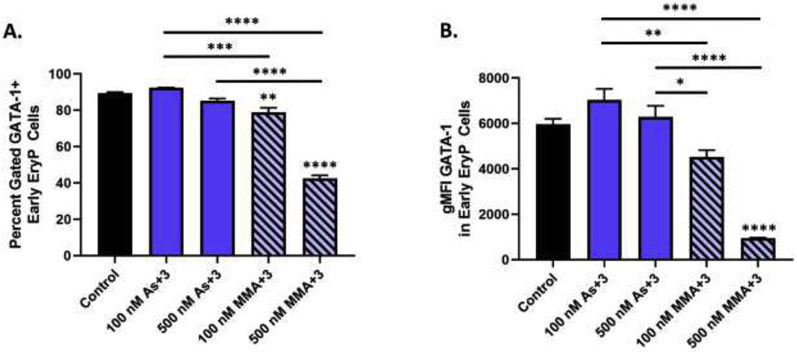
As+3 and MMA+3 produce differential suppressive effects on GATA-1 protein in surface marker defined early erythroid progenitor cells. (A) Percentage of GATA-1+ early erythroid progenitors following 24 h exposure to As+3 or MMA+3. (B) GATA-1 geometric mean fluorescence intensity in early erythroid progenitors. Data are expressed as mean ± SEM. Statistically significant differences compared to control or between exposure groups (as indicated by the bars) in one-way ANOVA followed by Tukey’s post hoc test (n = 3; *p<0.05, **p<0.01, ***p<0.001, ****p<0.0001).