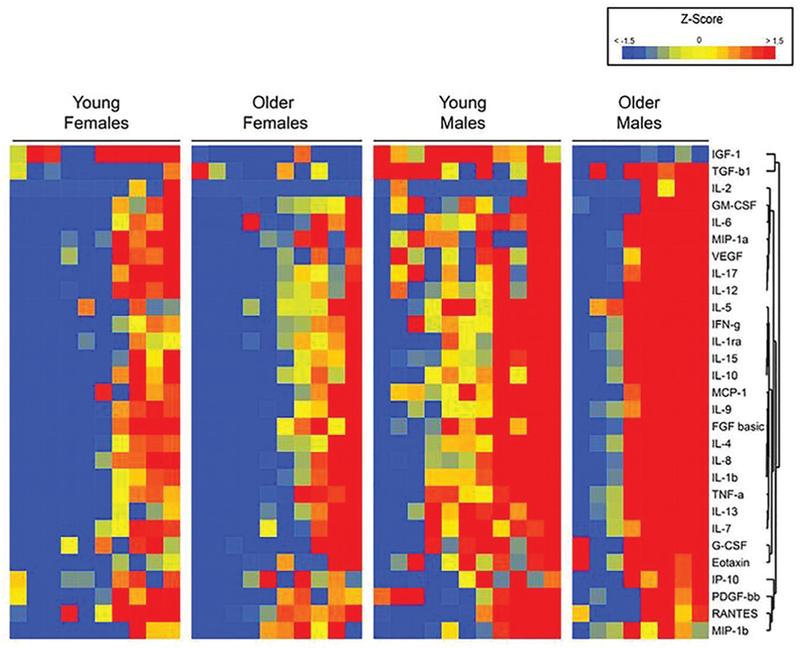
Figure 1.

Heat-map comparison of cytokines and growth factors. This map demonstrates within- and across-group variations in cytokine and growth factor levels. Each individual molecule is normalized to the mean of the entire group and the color determined by the corresponding Z score, with low scores represented in blue and high scores represented in red. Note that there are patients with low (blue) and high (red) levels of cytokines in each group.
