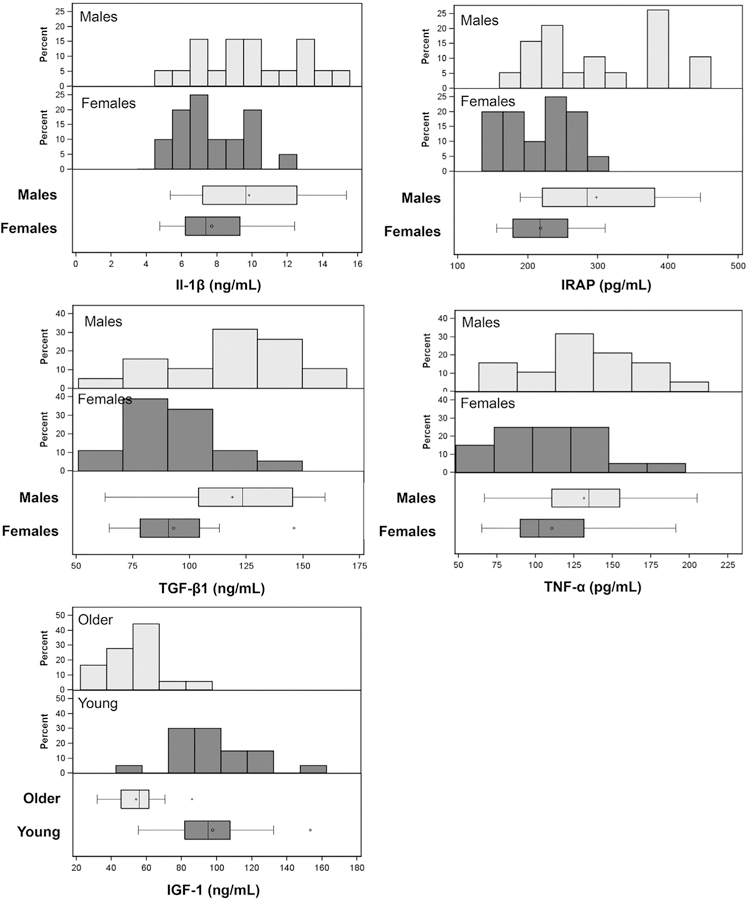
Figure 2.

Cytokine and growth factor distributions of female compared with male patients. Histogram plots grouped by sex for interleukin–1 beta (IL-1β) (7.71 vs 9.83 pg/mL, respectively; P = .008), tumor necrosis factor–alpha (TNF-α) (110.5 vs 131.6 pg/mL, respectively; P = .048), IL-1 receptor antagonist protein (IRAP) (218.0 vs 298.0 pg/mL, respectively; P < .001), and transforming growth factor–beta 1 (TGF-β 1) (92.8 vs 118.8 ng/mL, respectively; P = .002) as well as insulin-like growth factor–1 (IGF-1) grouped by age (97.6 vs 53.8 ng/mL, for younger vs older; P < .001). Although an overall pattern of higher cytokine or growth factors is apparent in male compared with female patients, there is intragroup variation and overlap in the distributions.
