Fig. 3.
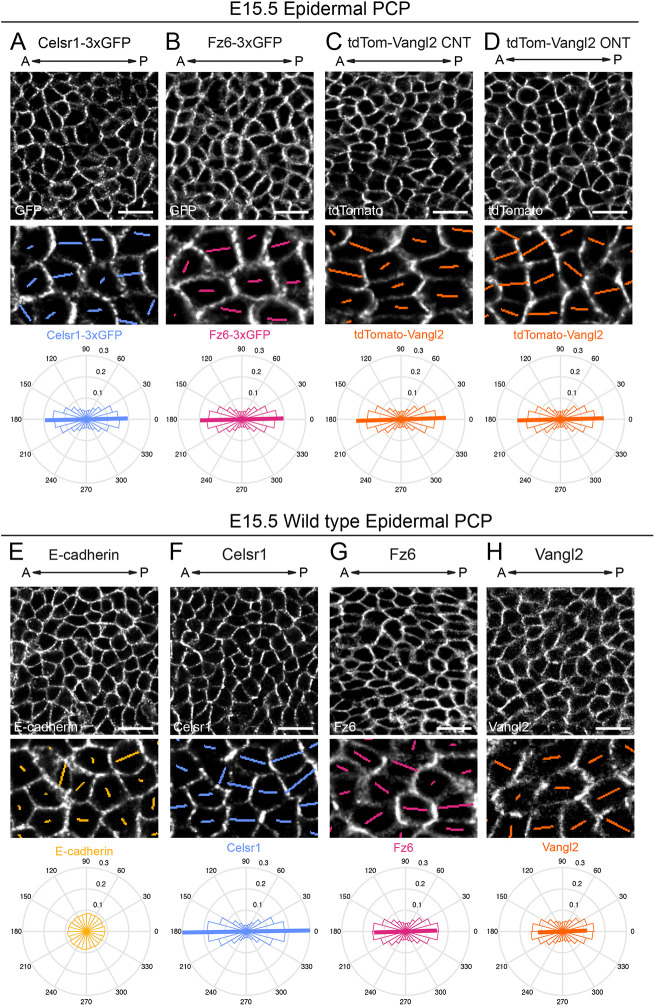
Planar polarized distribution of Celsr1-3xGFP, Fz6-3xGFP and tdTomato-Vangl2 in the epidermis. (A-H) Representative planar views of the basal layer of the interfollicular epidermis in E15.5 epidermis showing fluorescently-tagged PCP protein distributions in homozygous embryos (A-D) and Celsr1, Fz6, Vangl2 and E-cadherin localization in wild-type epidermis as detected by immunofluorescence against the endogenous untagged proteins (E-H). Anterior is to the left. Magnified areas below are overlaid with colored lines representing the axis (line angle) and magnitude (line length) of polarity. Quantification of polarity distributions are displayed below on circular histograms. (A) Celsr1-3xGFP, n=13,605 basal cells, three embryos. (B) Fz6-3xGFP, n=18,665 basal cells, three embryos. (C) tdTomato-Vangl2 in embryos displaying a CNT phenotype (CNT), n=10,775 basal cells, three embryos. (D) tdTomato-Vangl2 in embryos displaying an open neural tube (ONT) phenotype, n=9884 basal cells, three embryos. (E) E-cadherin, n=12,669 basal cells, three embryos. Note that compared with endogenous and tagged PCP proteins, E-cadherin is uniformly distributed at cell junctions. (F) Celsr1 distribution, n=12,669 basal cells, three embryos. (G) Fz6 distribution, n=8162 basal cells, three embryos. (H) Vangl2 distribution, n=9300 basal cells, three embryos. Scale bars: 20 µm.

