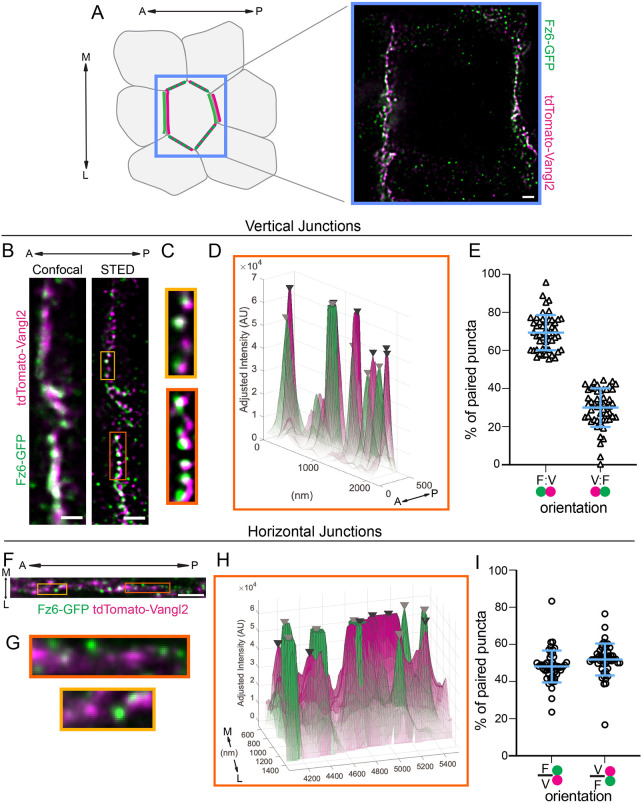
Fig. 4.
Super-resolution (STED) imaging of Fz6-3xGFP and tdTomato-Vangl2 resolves their asymmetric localization. (A-I) Whole-mount E15.5 Fz6-3xGFP/Fz6-3xGFP; tdTomato-Vangl2/+ skins labeled for GFP and tdTomato and imaged using stimulated emission depletion microscopy (STED). Anterior is oriented to the left. (A) Schematic of PCP localization in basal epidermal cells (left). Anterior-posterior (A-P; vertical) and mediolateral (M-L; horizontal) junctions of a single cell are highlighted. STED image of a full cell with Fz6-3xGFP (green) and tdTomato-Vangl2 (magenta) (right). Note that horizontal junctions appear less bright and punctate than vertical junctions. (B-I) STED imaging and analysis of vertical (B-E) and horizontal (F-I) junctions. (B,F) Representative planar view of Fz6-3xGFP (green) and tdTomato-Vangl2 (magenta) localization at a vertical junction imaged using standard confocal imaging (left) and STED (right) (B) and at a horizontal junction (F). (C,G) Magnified regions of the junction corresponding to the boxed areas in B and F. (D,H) Corresponding surface plots of GFP and tdTomato fluorescence intensity along the junction of the magnified region outlined in orange in B and F. Black and gray arrowheads mark tdTomato-Vangl2 and Fz6-3xGFP peaks, respectively. Opacity of the plot corresponds to pixel intensity, with low opacity indicating low pixel intensity and high opacity indicating high pixel intensity. Note in horizontal junctions (H) that the non-peak signal is more diffuse with higher opacity compared with vertical junctions (D). (E) Quantification of the orientation of puncta pairs in vertical junctions. The percent of puncta pairs along a junction in the F-V orientation (where Fz6-3xGFP localizes to the anterior of each puncta pair) versus the V-F orientation, n=50 junctions, three embryos. (I) Quantification of the orientation of puncta pairs in horizontal junctions. The percent of puncta pairs along a junction in the F-V orientation (where Fz6-3xGFP localizes to the medial side of the pair) versus V-F orientation, n=51 junctions, three embryos. Blue bar overlay indicates the mean±s.d. across all junctions. Scale bars: 1 µm.

