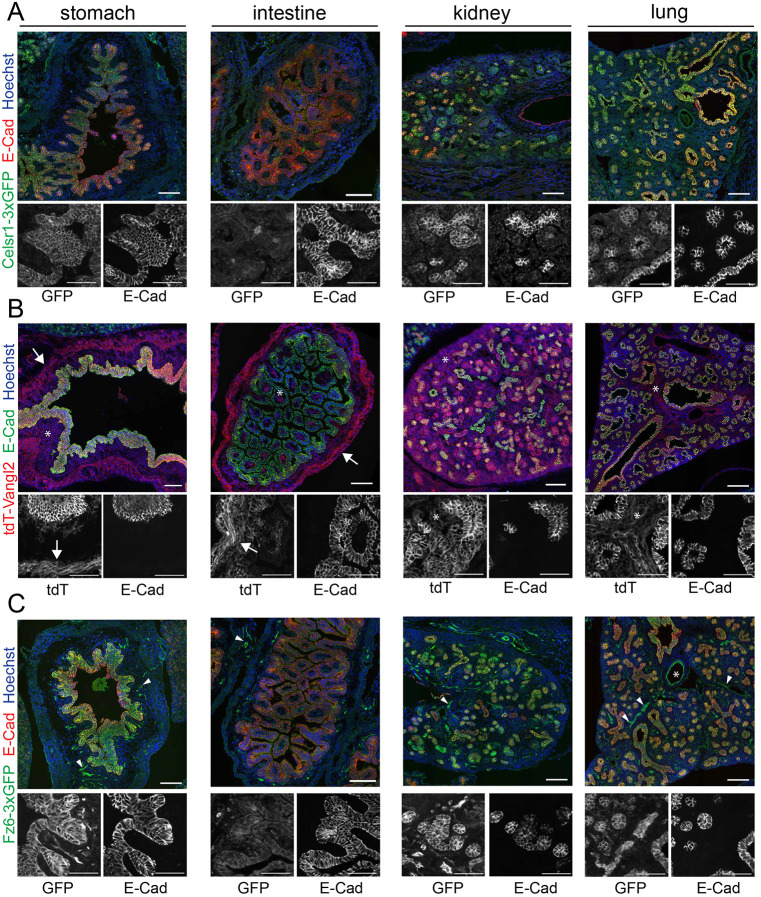
Fig. 8.
Celsr1-3xGFP, Fz6-3xGFP and tdTomato-Vangl2 expression and localization across embryonic organs. (A-C) Sagittal sections from Celsr1-3xGFP, tdTomato-Vangl2 and Fz6-3xGFP embryos at E16.5 labeled with E-cadherin to mark epithelia and Hoechst (blue) to mark nuclei. Composite images of E16.5 sagittal sections showing Celsr1-3xGFP (A, green), tdTomato-Vangl2 (B, red) and Fz6-3xGFP (C, green) expression in the stomach, intestine, kidney and lung. Below each merged image are zoomed-in regions of individual channels in grayscale. In B, arrows indicate expression in smooth muscle, asterisks denote expression in stromal cells. In C, arrowheads point to expression in vasculature, asterisk marks the lumen of a blood vessel in the lung. Scale bars: 100 µm (merged images); 50 µm (grayscale images).

