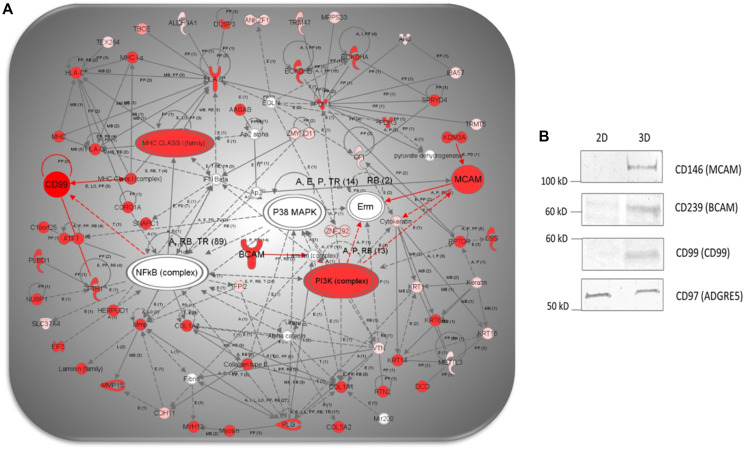
Figure 4.
(A). IPA network analysis of differentially expressed proteins showing a merged network generated from overlapping networks 2, 6 and 17, featuring CD99, CD239 and CD146, depicting direct (i.e., full red lines) and indirect (i.e., dotted red lines) interactions (i.e., highlighted in red), previously described in the literature. (B) Comparative WB analysis showing cropped images of CD99, CD239 and CD146 in 3D- and 2D-cultured NCI-H23 cells.

