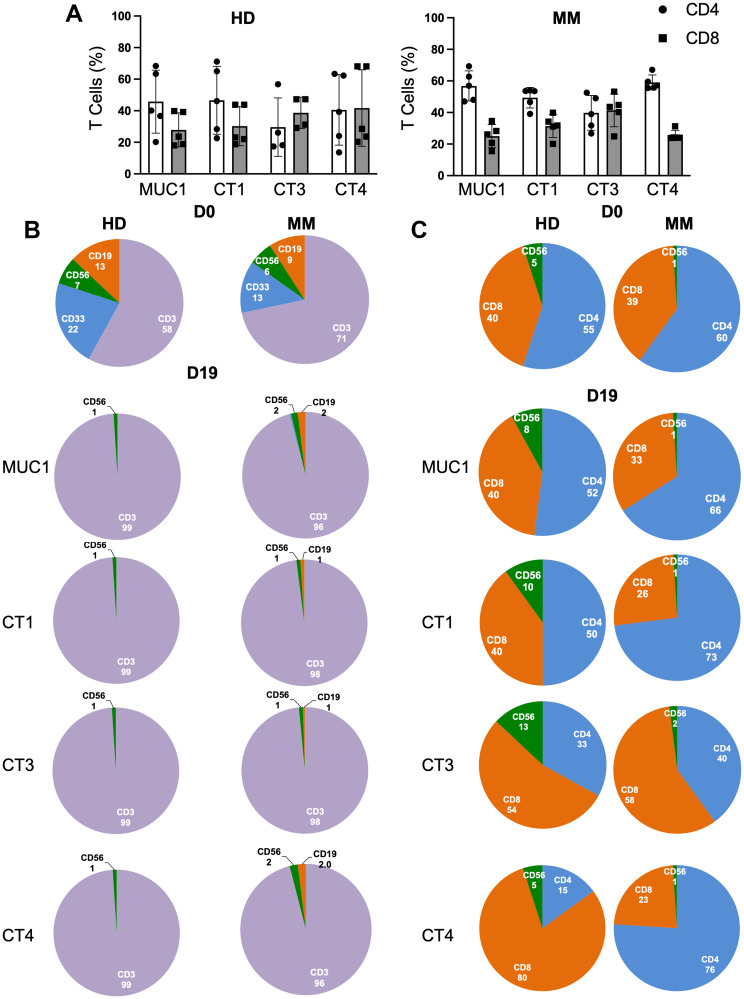
Figure 3. Stimulation with peptide cocktails enriches T cells equivalently regardless of the disease status.
(A) Depiction of percentages of CD4+ (white) and CD8+ (grey) T cells at the end of culture period for 5 HDs (left panel) and 5 MM patients (right panel). (B) Pie charts showing percentages of immune cell subsets on D0 or D19 at end of culture period of PBMCs of HD (left panel) and MM patient (right panel) with MUC1 cocktail and cocktails 1, 3, and 4. CD19 (orange), CD56 (green), CD33 (blue) and CD3 (purple) are shown. CD3+ population on D19 was always greater than 85% positive. (C) CD3+ T cells were further analyzed for CD4+ (blue), CD8+(orange) and CD56+ (green) for HD (left panel) and MM patient (right panel). Percents of CD4+ and CD8+ T cells depended upon the particular cocktail used for primary stimulation and the HLA genotype of the individual. Data were similar for all ten samples. No statistically significant differences were observed (Student’s t-test). Representative data are shown.

