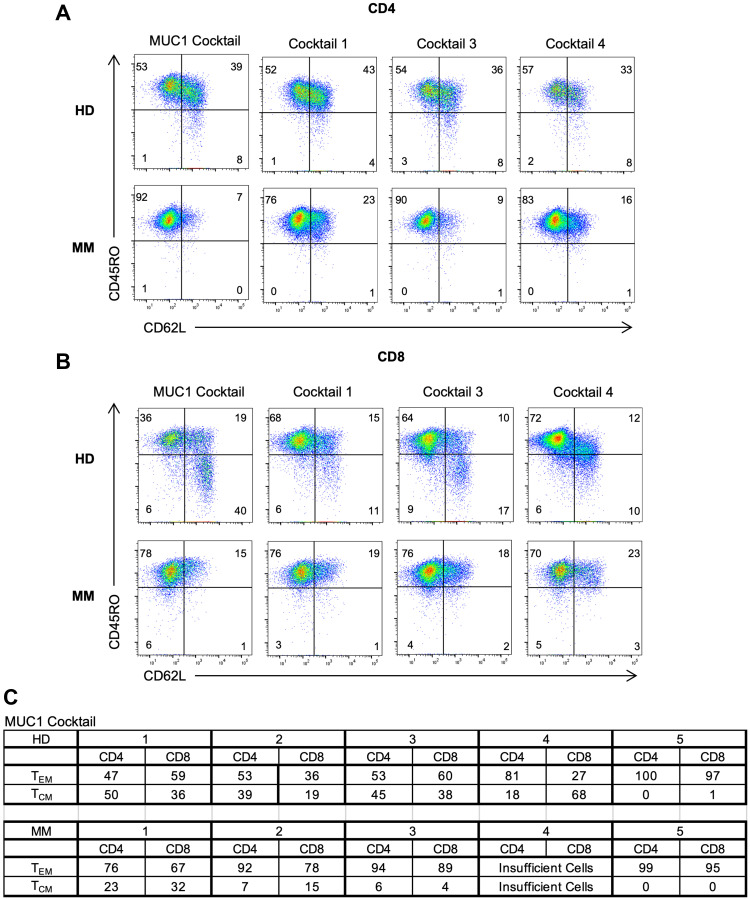
Figure 4. Generation of both effector and memory T cells in MM patients and HDs following peptide activation.
Flow cytometry dot plots depicting (A) CD4+ and (B) CD8+ TEM (CD45RO+CD62L-) and TCM (CD45RO+CD62L+) for HD and MM on D19 following stimulation of multipeptide cocktails. Representative data shown for 2 individuals. (C) Chart showing composite results of TEM and TCM for MUC1-activated HD (top) and MM patients (bottom). Statistical analysis indicated no significant differences (Student’s t-test).

