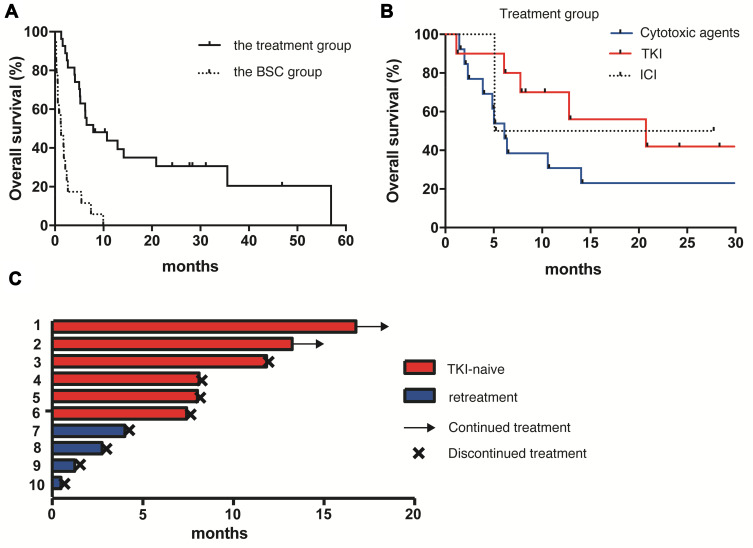
Figure 2.
Kaplan–Meier analysis of overall survival in the treatment and the BSC groups (A), and in the groups treated with cytotoxic agents, TKI and ICI (B). Swimmer plot in the TKI-naïve and -retreatment groups (C).
Abbreviations: BSC, best supportive care; TKI, tyrosine kinase inhibitors; ICI, immune checkpoint inhibitors.

