
FIGURE 3.
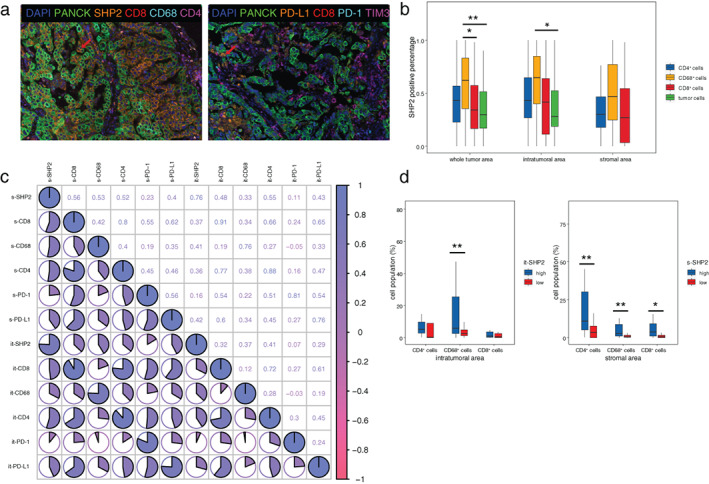
The correlation between SHP2 and immune cells. (a) Representative multiplexed immunofluorescence cytochemistry (mIFC) staining of SHP2, CD4, CD8, CD68, and CKs (panel 1) (left), and CD8, PD‐L1, PD‐1, TIM3, and CKs (panel 2) (right). (b) The percentage of SHP2+/CD8+ T cells, SHP2+/CD4+ T cells, and SHP2+/CD68+ macrophages in CD8+ T cells, CD4+ T cells, and CD68+ macrophages, respectively. (c) Heatmap of correlation analysis including SHP2, CD8, CD4, CD68, PD‐1, and PD‐L1 in intratumoral and stromal area. “X” in the circle means there is no significance. PD‐L1, programmed death ligand 1. (d) Quantification of CD8+, CD4+, and CD68+ cells in high and low expression level of it‐SHP2 and s‐SHP2. *p < 0.05, **p < 0.01