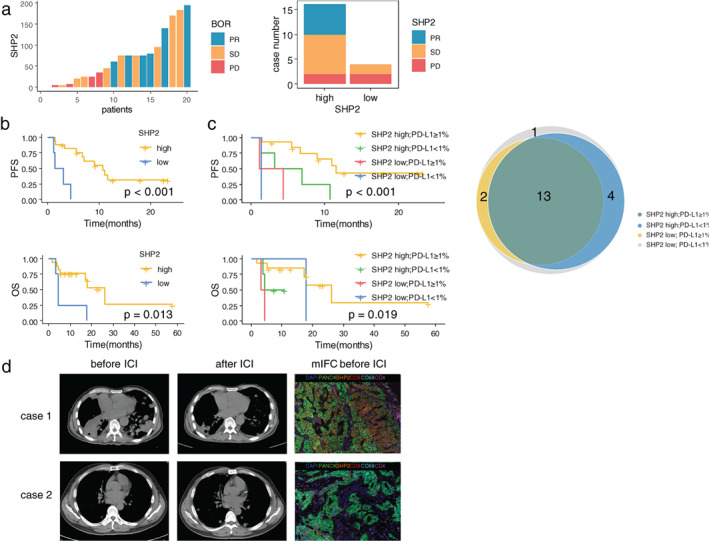
FIGURE 4.

Kaplan–Meier curves for PFS and OS according to the expression level of SHP2 and PD‐L1. (a) Best overall response (BOR) and the expression level of SHP2 in patients available for survival analysis. PR, partial respond; SD, stable disease; PD, progress disease. (b) PFS and OS in patients with high SHP2 expression versus low SHP2 expression. PFS, progression‐free survival; OS, overall survival. (c) PFS and OS in patients with high/low SHP2 and PD‐L1. Venn diagram depicting the number of patients with different SHP2 and PD‐L1 expression state. PD‐L1, programmed death ligand 1. (d) Radiological evaluation before and after ICI and mIFC analysis of two patients with high (case 1) and low (case 2) expression of SHP2. ICI, immune checkpoint inhibitor; mIFC, multiplexed immunofluorescence cytochemistry
