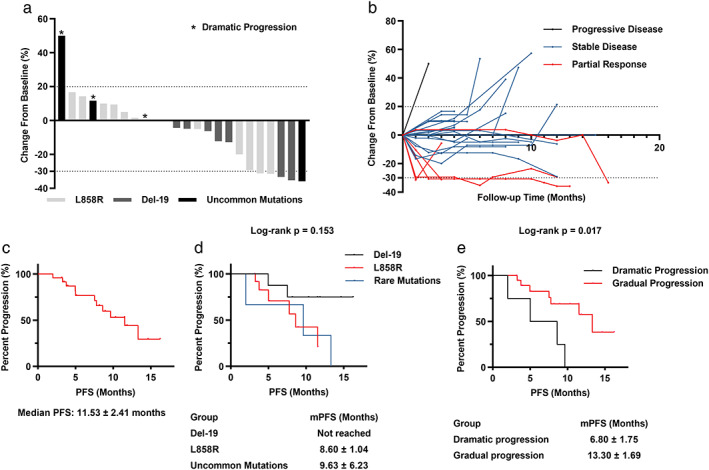
FIGURE 6.

Anlotinib reversed the EGFR–TKI resistance in patients. (a) The maximal tumor shrinkage of patients receiving EGFR–TKI and anlotinib therapy. (b) The changes of tumor burden in individual patients after combination therapy. (c) Kaplan–Meier PFS curve for all patients. (d) Kaplan–Meier PFS curve stratification based on EGFR mutation type. (e) Kaplan–Meier PFS curve stratification based on prior EGFR–TKI failure mode
