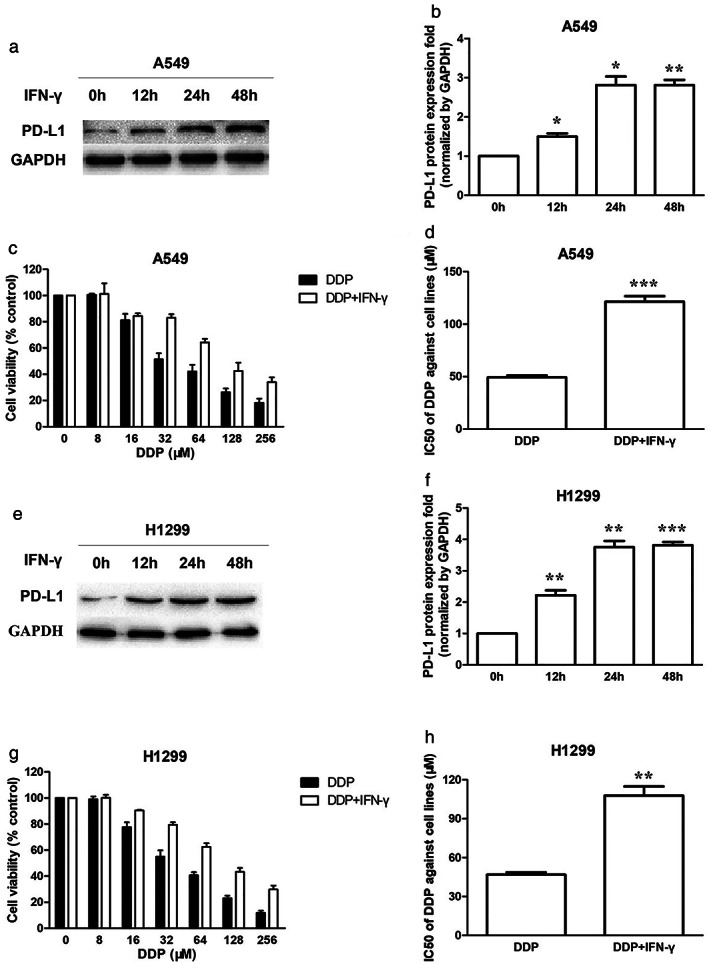
FIGURE 2.

Increase of PD‐L1 enhanced DDP resistance in A549 and H1299 cells. (a) PD‐L1 protein expression in A549 cells when treated with 10 ng/ml IFN‐γ for 0, 12, 24, 48 h. (b) PD‐L1 protein quantification of the western blot results in A549 cells treated with IFN‐γ. Protein levels were normalized to the GAPDH levels and are shown as fold increase or decrease relative to the levels for the control strain. (c) The cytotoxicity of DDP against A549 cells in the absence or presence of IFN‐γ (10 ng/ml) when treated for 48 h. (d) The IC50 of DDP against A549 cells in the absence or presence of IFN‐γ (10 ng/ml) when treated for 48 h. (e) PD‐L1 protein expression in H1299 cells when treated with 10 ng/ml IFN‐γ for 0, 12, 24, 48 h. (f) PD‐L1 protein quantification of the western blot results in H1299 cells treated with IFN‐γ. (g) The cytotoxicity of DDP against H1299 cells in the absence or presence of IFN‐γ (10 ng/ml) when treated for 48 h. (h) The IC50 of DDP against H1299 cells in the absence or presence of IFN‐γ (10 ng/ml) when treated for 48 h. Data represents the mean ± SD of three independent experiments (*p < 0.05; **p < 0.01; ***p < 0.001). IFN‐γ, interferon‐γ
