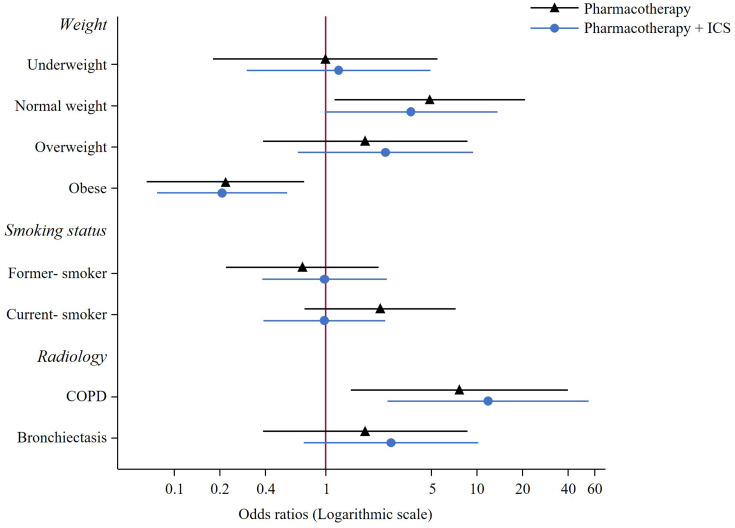
Figure 3.
Coefficient plot showing univariate logistic regression effects (Odds ratio [95% confidence interval]) by reported levels of pharmacotherapy usage against no pharmacotherapy. Note that non-smoker and combined chronic obstructive pulmonary disease (COPD) + bronchiectasis are omitted due to low numbers.
Abbreviation: ICS, inhaled corticosteroids.

