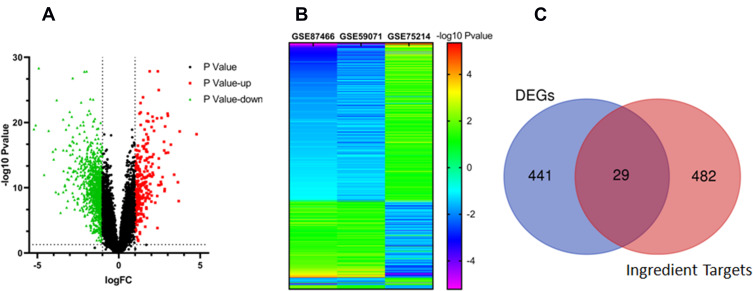
Figure 4.
The overlapped targets screening strategy. (A) The volcano plot of the differentially expressed genes (DEGs) in datasets of GSE87466, GSE59071, and GSE75214.The red nodes represent up-regulated DEGs, while green nodes represent down-regulated DEGs; the horizontal dashed lines show the P value is less than 0.05 and the vertical dashed lines indicate the value of /log2 fold change (FC)/ is more than 1. (B) Heatmap of DEGs. The vertical axis represents the genes. The horizontal axis shows the change of expression levels of DEGs in datasets of GSE87466, GSE59071, and GSE75214 by -log10Pvalue. (C) Overlap genes of DEGs and predicted compound targets.

