
Figure 1.
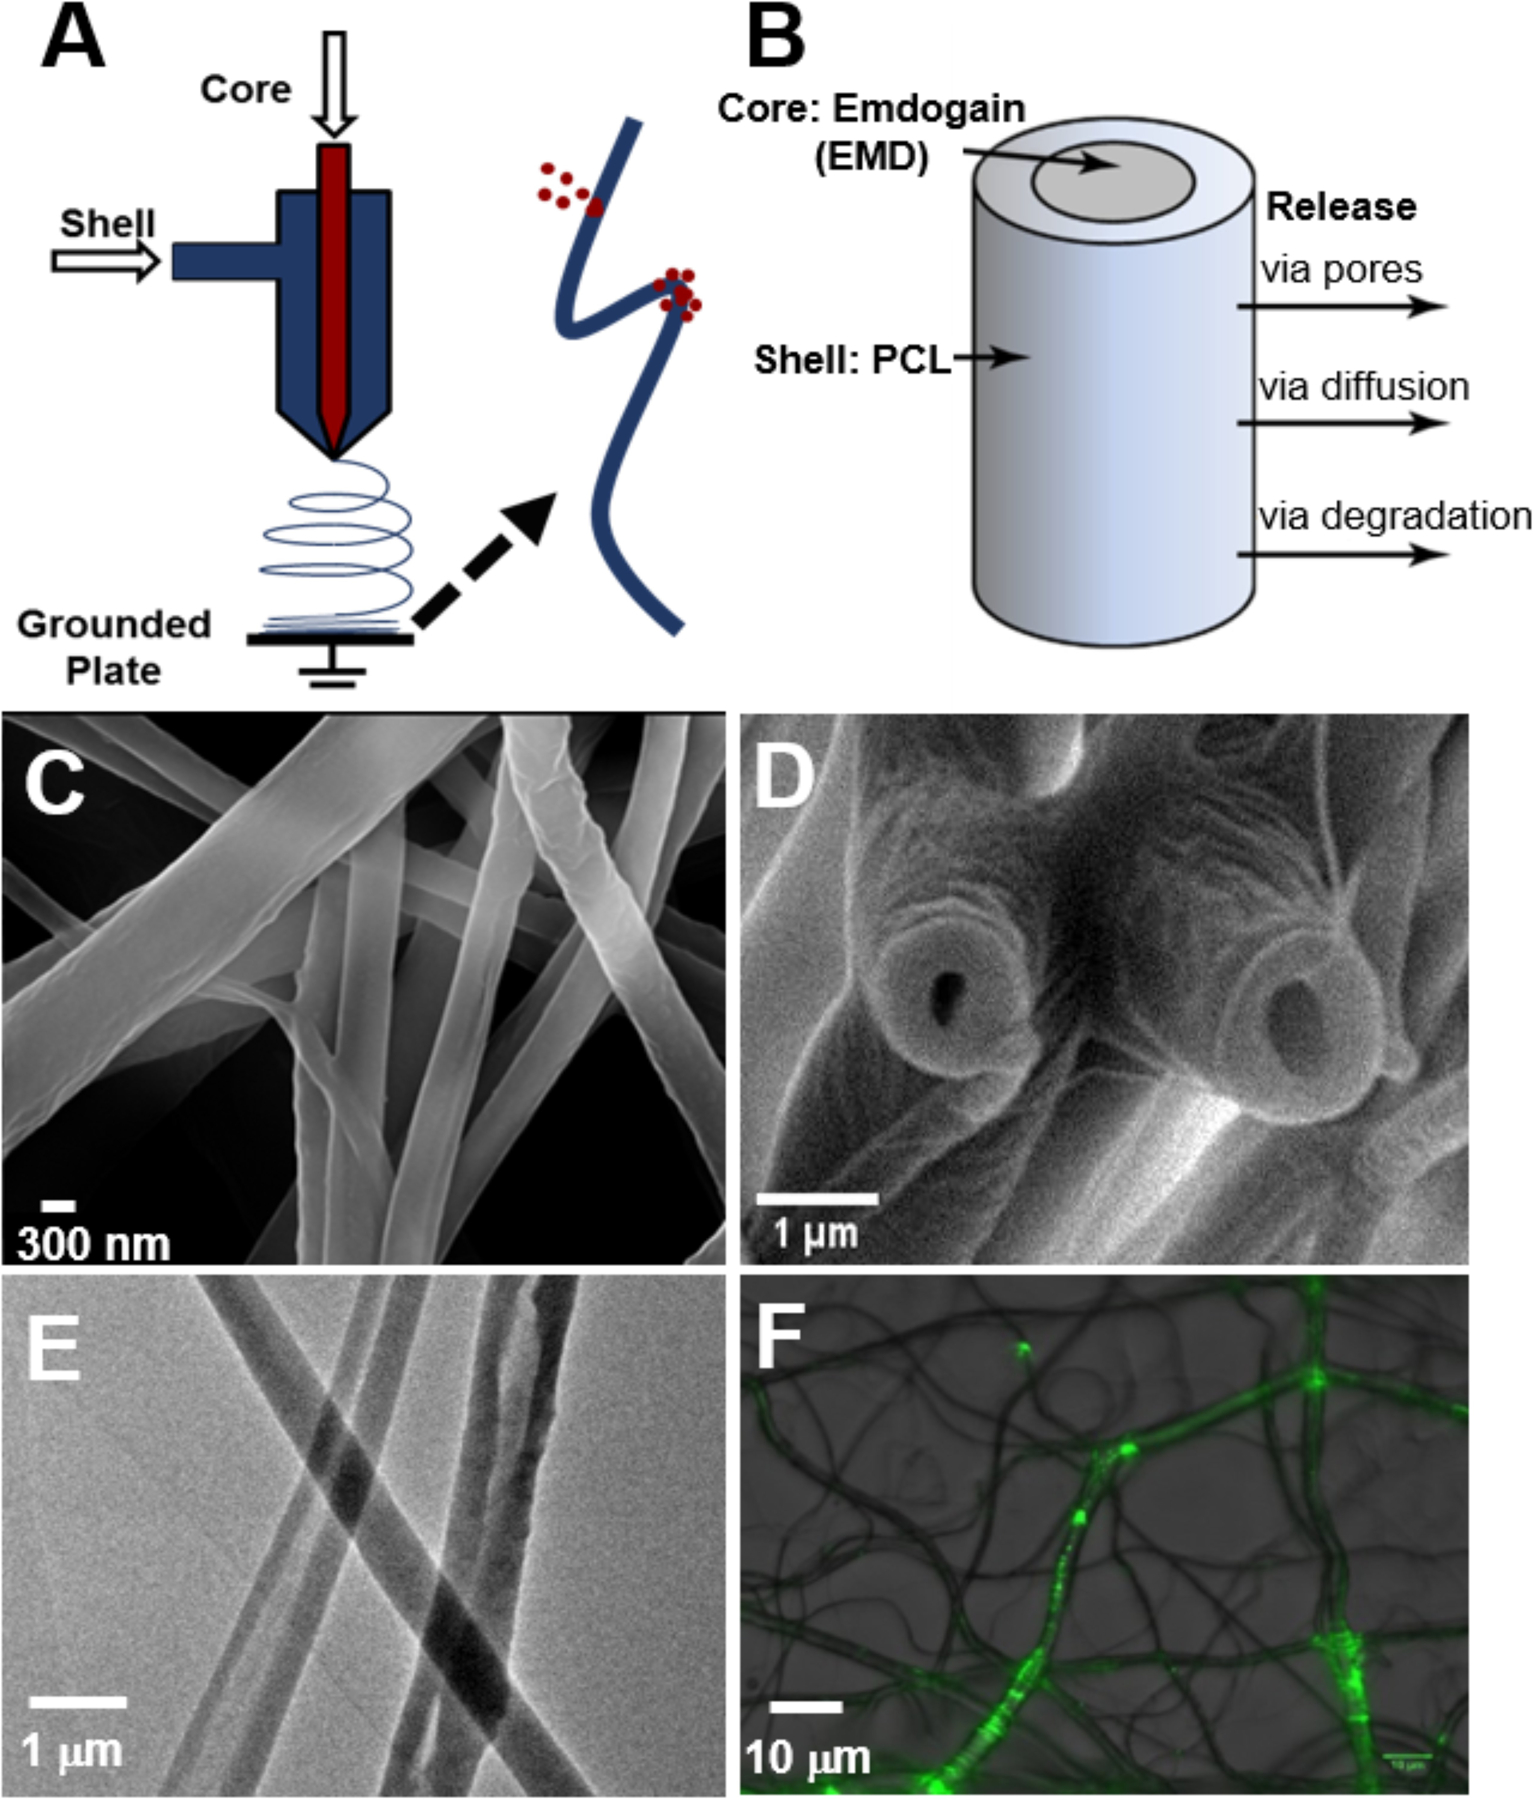
(A) Schematic illustration of coaxial electrospinning. (B) Schematic representation of a core-shell nanofiber. (C) SEM images of core-shell nanofibers spun at 2.0/0.4 mL/h (shell/core flow rate). (D) SEM cross-section image of core-shell nanofibers upon freeze-fracturing. (E) TEM image shows hollow structure and core-shell composition of nanofibers. (F) Epifluorescent images show encapsulated FITC-BSA in nanofibers.