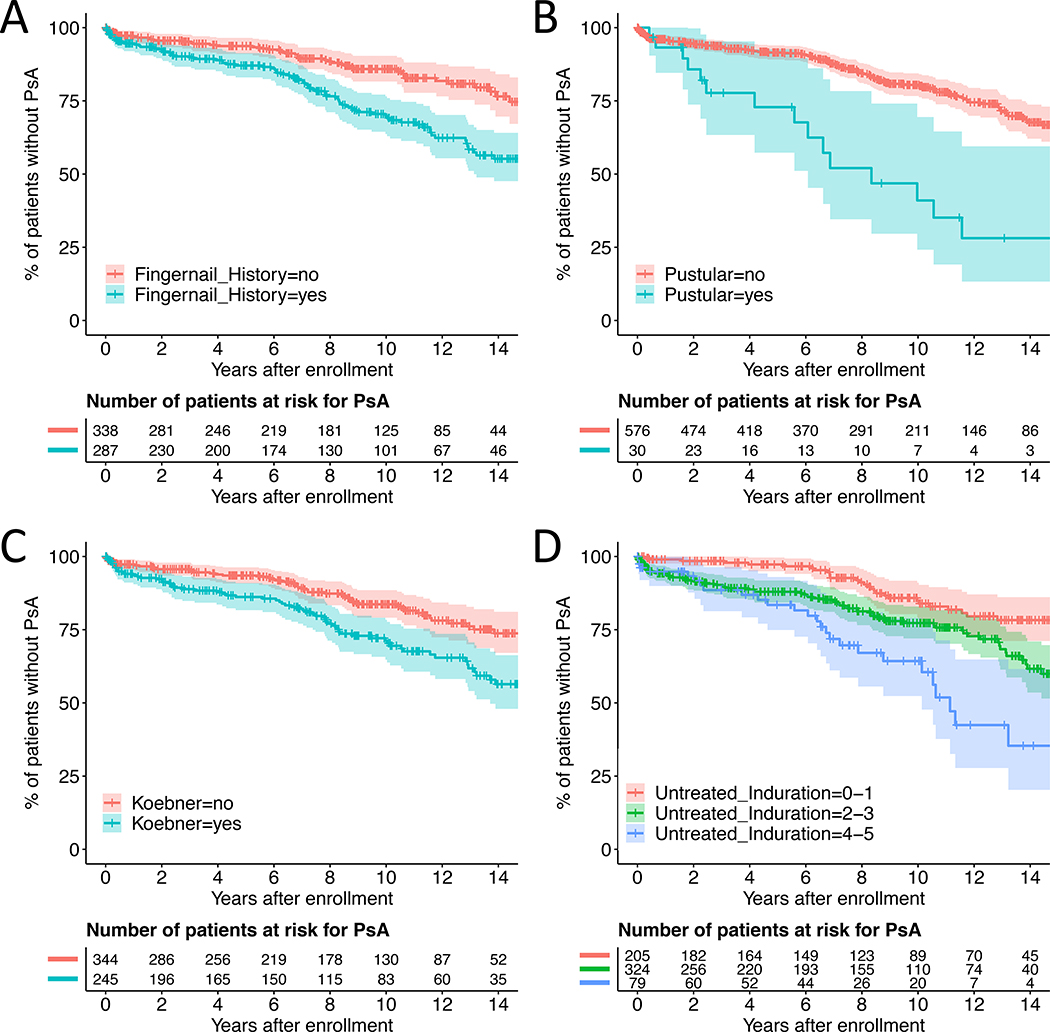
Figure 2. Kaplan-Meier curves for PsA development stratified by psoriasis characteristics.
Panel (A) history of fingernail psoriasis, (B) pustular psoriasis, (C) Koebner phenomenon, (D) untreated induration. Induration was measured on a 0–5 scale, 0 being not present and 5 being the most severe. The x-axis is time in years from enrollment. The y-axis is the cumulative probability of not developing PsA.

