
Figure 1. APOBEC3 expression increases during early NSCLC evolution.
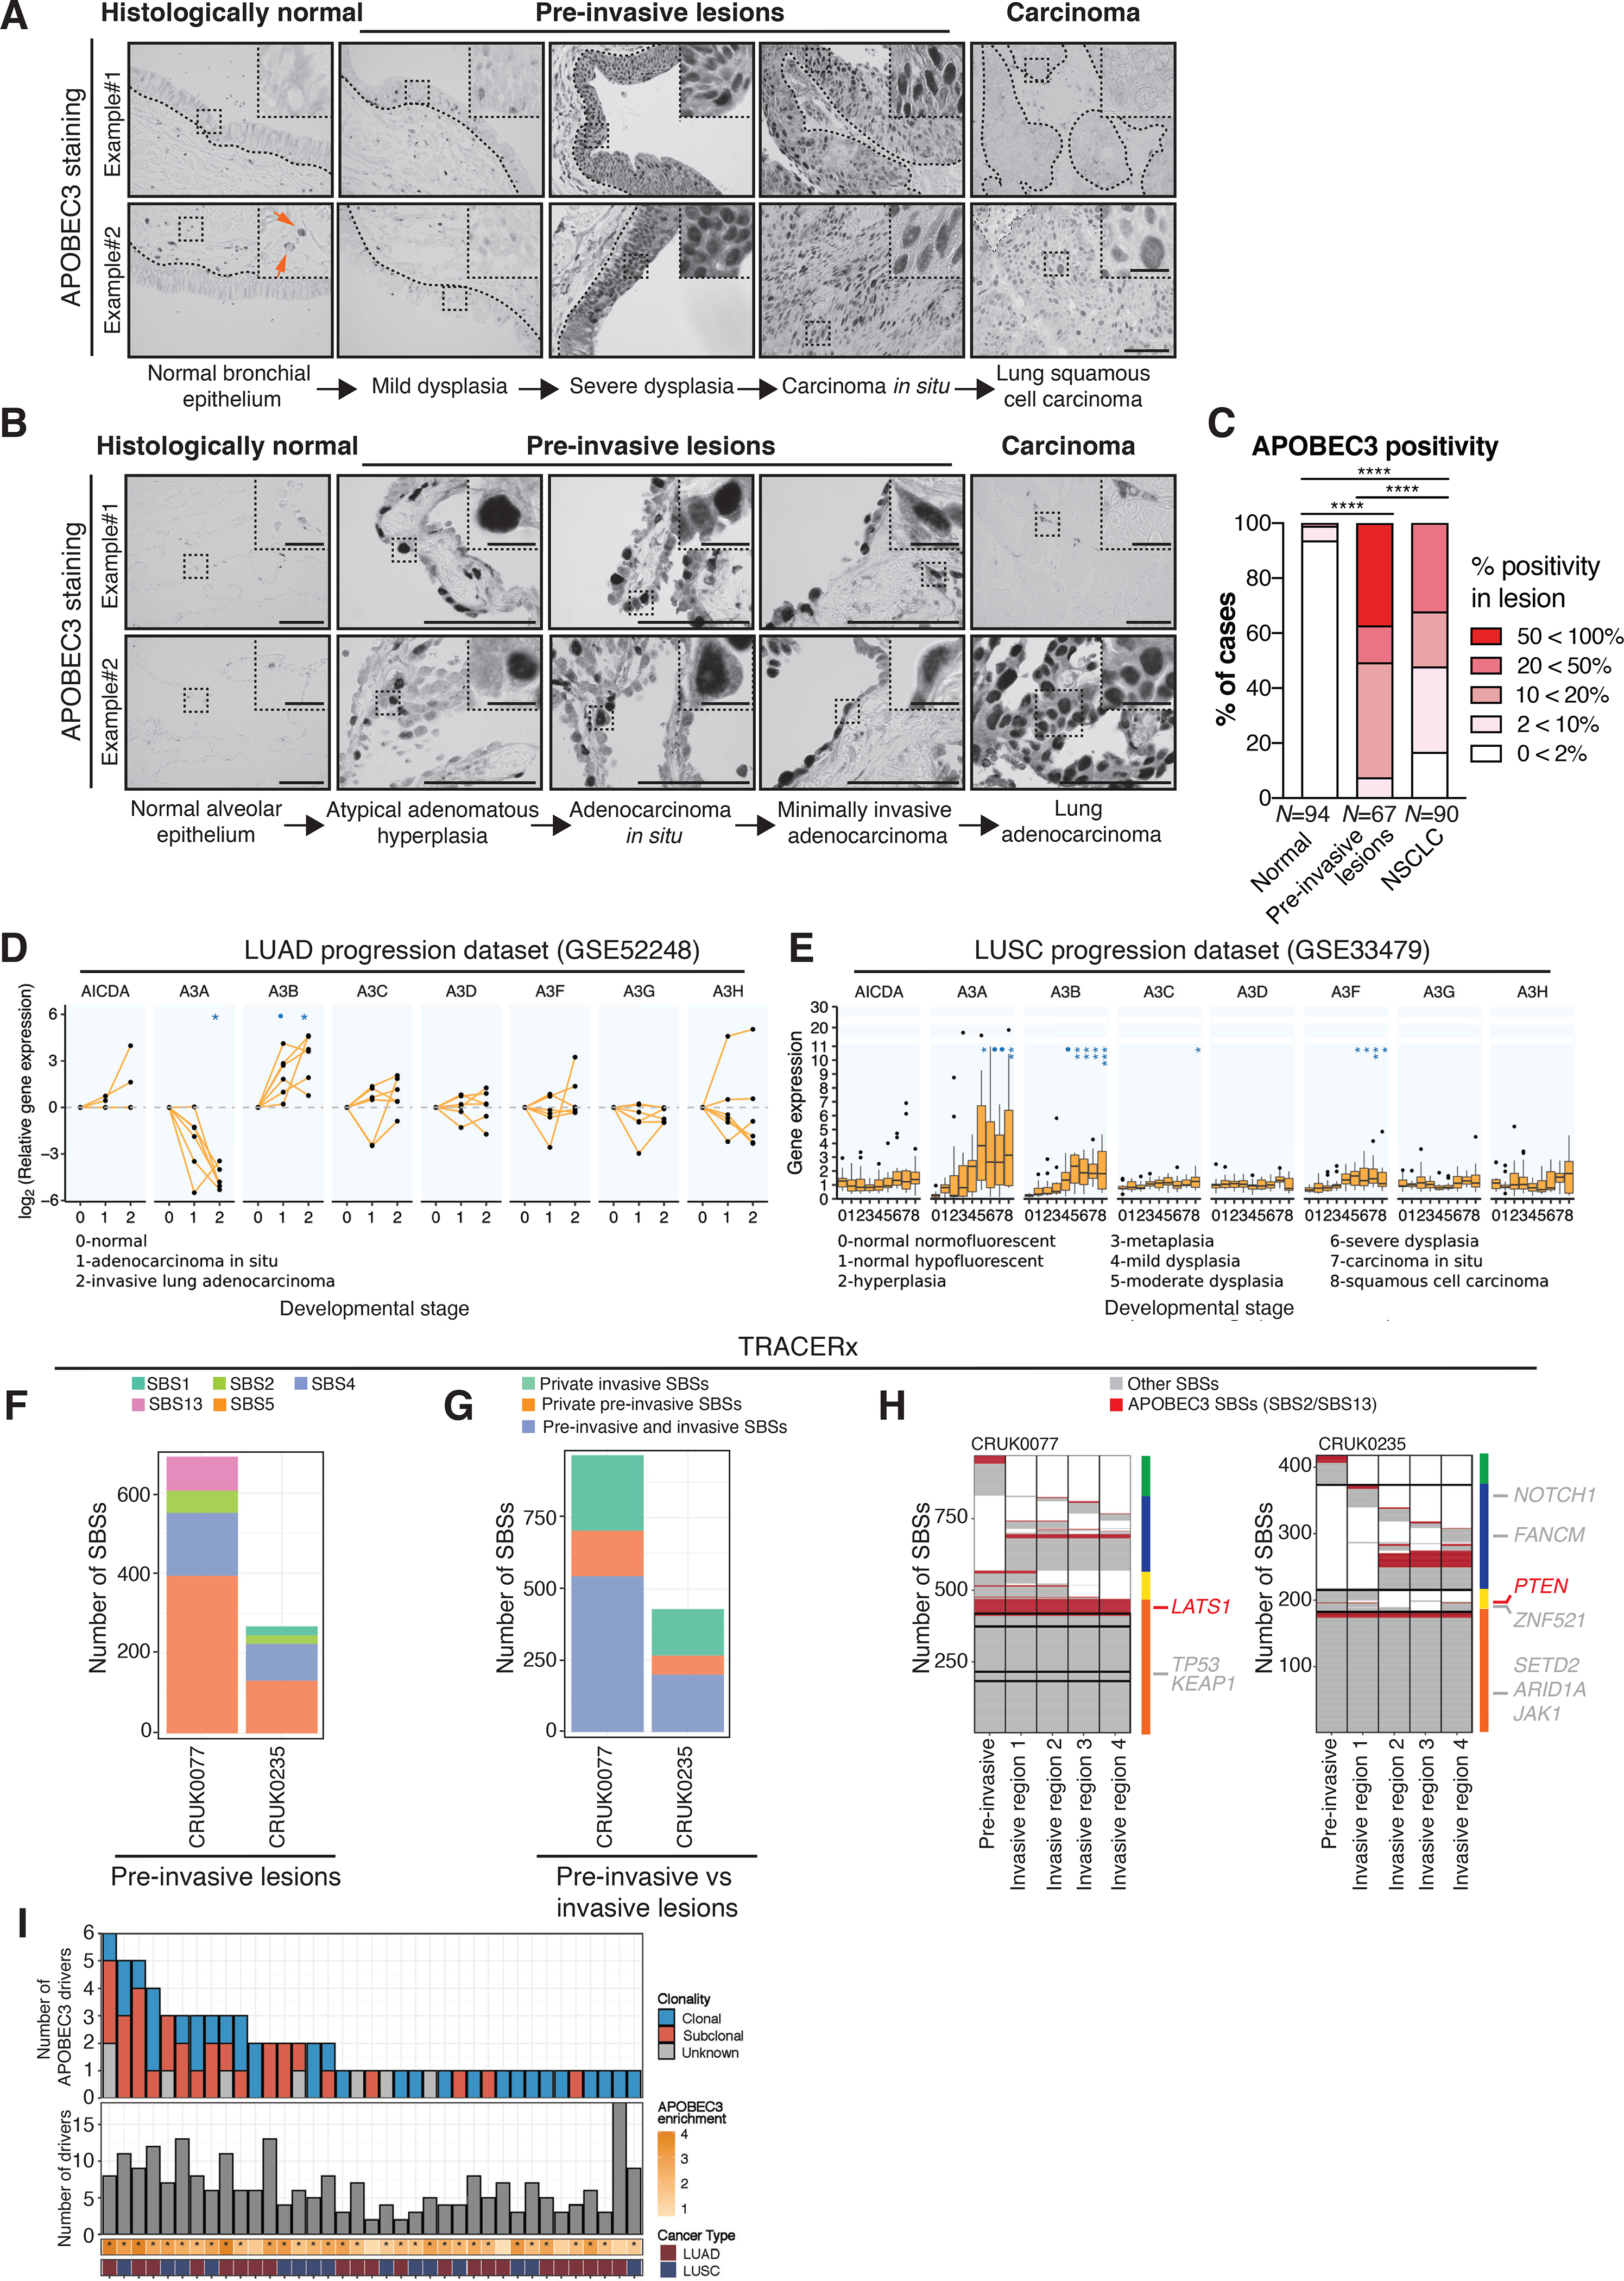
A-B, Representative images from 2 different samples with APOBEC3 immunohistochemistry in normal lung epithelium, pre-invasive lesions, LUSC and LUAD. Note the nuclear APOBEC3 staining in epithelial cells, which is indicative of A3B and potentially also A3A staining. The samples originate from NSCLC patients from the TRACERx 100 cohort (1), the UCLH Surveillance Study (29) and a Danish cohort of NSCLC patients. The orange arrows indicate stromal cells that have cytoplasmic APOBEC3 staining, which is indicative of A3G and A3A. The black dotted lines indicate the epithelial lining. C, Summary of APOBEC3 nuclear positivity in NSCLC development as assessed by immunohistochemistry. Percentage of cases scoring between 0<2%, 2<10%, 10<20%, 20<50% and 50<100% APOBEC3 positivity in each category are shown (N = 251 cases in total). The number of cases scoring >10% nuclear positivity was compared between each group (two-tailed Fisher’s exact test, ****P ≤ 0.0001). D, APOBEC3 gene expression during different stages of LUAD relative to normal tissue (N = 18 samples, linear mixed-effects model, •(blue dot)FDR ≤ 0.1, *FDR ≤ 0.05). Each dot represents a sample. The connected dots represent samples from the same patient. E, APOBEC3 gene expression during different stages of LUSC carcinogenesis. The boxplots represent median ± 1st and 3rd quartiles, P-values are FDR-adjusted for multiple comparison (N = 122 samples from 77 patients, linear mixed-effects model, •(blue dot)FDR ≤ 0.1, *FDR ≤ 0.05, **FDR ≤ 0.01, ***FDR ≤ 0.001). F, Number of SBSs as detected by whole-exome sequencing (WES) in 2 pre-invasive NSCLC lesions. Each color represents a different SBS signature. G, Number of SBSs in the 2 synchronous patient-matched pre-invasive and invasive NSCLCs that are ubiquitous between the pre-invasive and invasive lesion or private (i.e. exclusive) to the pre-invasive or invasive lesion, respectively. H, Heat maps show the distribution of APOBEC3- (red) and non-APOBEC3-mediated (grey) SBSs. Columns next to the heat maps show the SBS distribution, which are either present in both the pre-invasive and all invasive regions (orange), present in both the pre-invasive but not all invasive regions (yellow), private to the invasive lesion (blue) or private to the pre-invasive lesion (green). Driver mutations are shown next to the heat map, indicating in which region they are present (in non-APOBEC3 context, grey; in APOBEC3 context, red). I, Overview of the total number of driver mutations (bottom panel) and the number of driver mutations in the APOBEC3 context (top panel). Asterisks indicate significant enrichment for APOBEC3 signature mutations (two-tailed Fisher’s exact test, P ≤ 0.05). Scale bars, 100 μm. Scale bar in inset magnification, 25 μm.