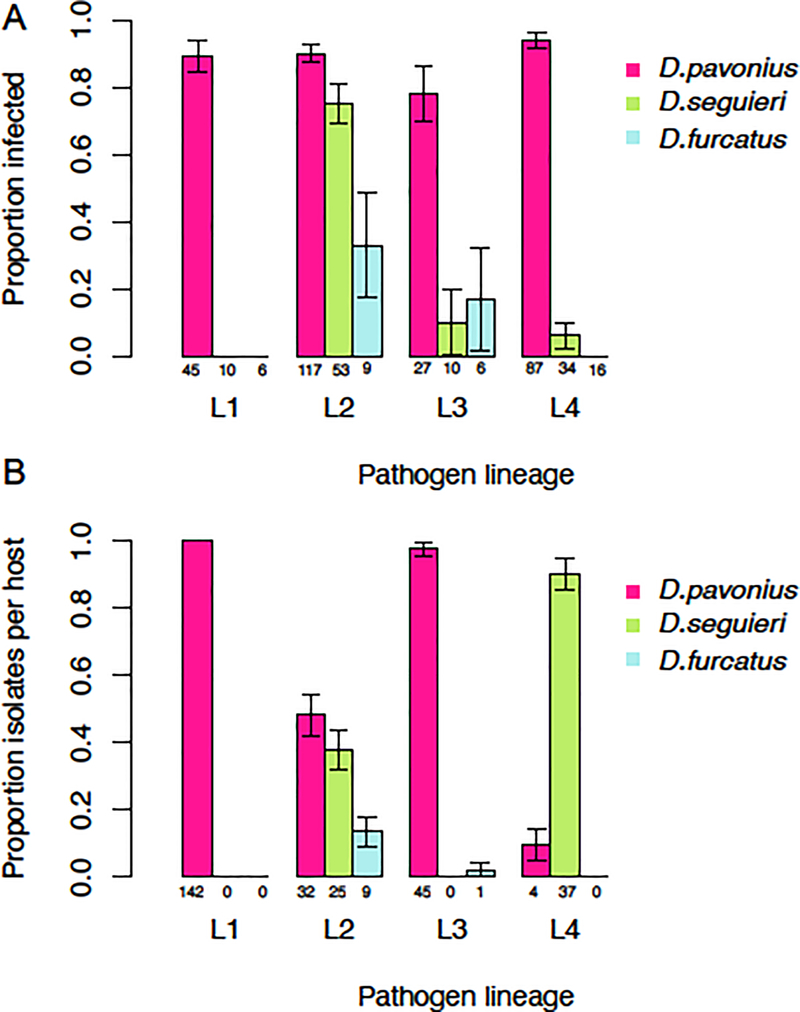
Fig. 2.
Comparison of the A) potential and B) realized host range of four Microbotryum lineages (L1-L4). A) Infection results from Experiment 1. Bars show the proportion of each host species infected by pathogen lineages L1-L4. Colors indicate host species: Dianthus pavonius (pink), D. seguieri (green), or D. furcatus (blue). Numbers indicate the total number that flowered and were scored. B) Field collections of the distribution of Microbotryum lineages on Dianthus species are shown for reference (data redrawn from Petit et al. 2017). Bars show the proportion of isolates from each lineage that were found on each host. Numbers of isolates in each category are indicated at the bottom. Error bars are 1 SEM.

