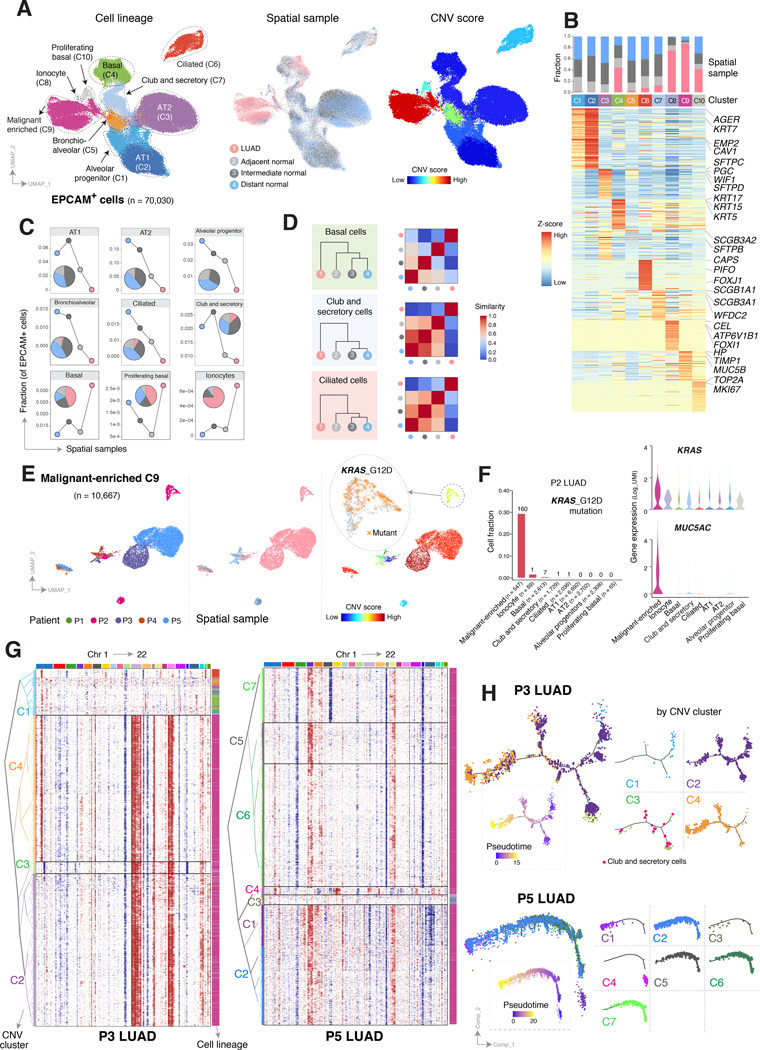
Figure 2. Epithelial lineage diversity and intratumoral heterogeneity in the spatial ecosystem of early-stage LUAD.
A, UMAP visualization of all EPCAM+ cells from P1-P5 colored (from left to right) by their assigned cell types, spatial samples, and inferred copy number variation (CNV) scores. B, Heatmap of major lineage marker genes for EPCAM+ cell clusters (C1–10 as shown in panel A, left), with corresponding bar blots outlining fraction by spatial sample. C, Area plot showing changes in EPCAM+ subset fractions across spatial samples. D, Hierarchical relationships of 3 representative subsets of epithelial cells (from top to bottom) among the spatial samples based on the computed Euclidean distance using transcriptomic features (left), and corresponding heatmaps quantifying similarity levels among spatial samples (right). Similarity score is defined as one minus the Euclidean distance. E, UMAP plots of cells in the malignant-enriched cluster C9 (panel A), colored by their corresponding patient origin (left), spatial sample (middle), and CNV score (right). The zoom in view of the right panel shows KRAS G12D mutant cells in P2. F, Fraction of cells carrying KRAS G12D mutation (left bar plot), with numbers indicating the absolute cell numbers, as well as expression levels of KRAS (violin plot, top right) and MUC5AC (violin plot, bottom right), within cells of each epithelial lineage cluster of P2. G, Unsupervised clustering of CNV profiles inferred from scRNA-seq data from patient P3 (left) and P5 (right) tumor samples using NK cells as control and demonstrating intratumoral heterogeneity in CNV profiles. Chromosomal amplifications (red) and deletions (blue) are inferred for all 22 chromosomes (color bars on the top). Each row represents a single cell, with corresponding cell type annotated on the right (same as in panel A). H, Potential developmental trajectories for EPCAM+ cells from P3 (top) and P5 (bottom) inferred by Monocle 3 analysis. Cells on the tree are colored by pseudotime (dotted boxes) and CNV clusters.

