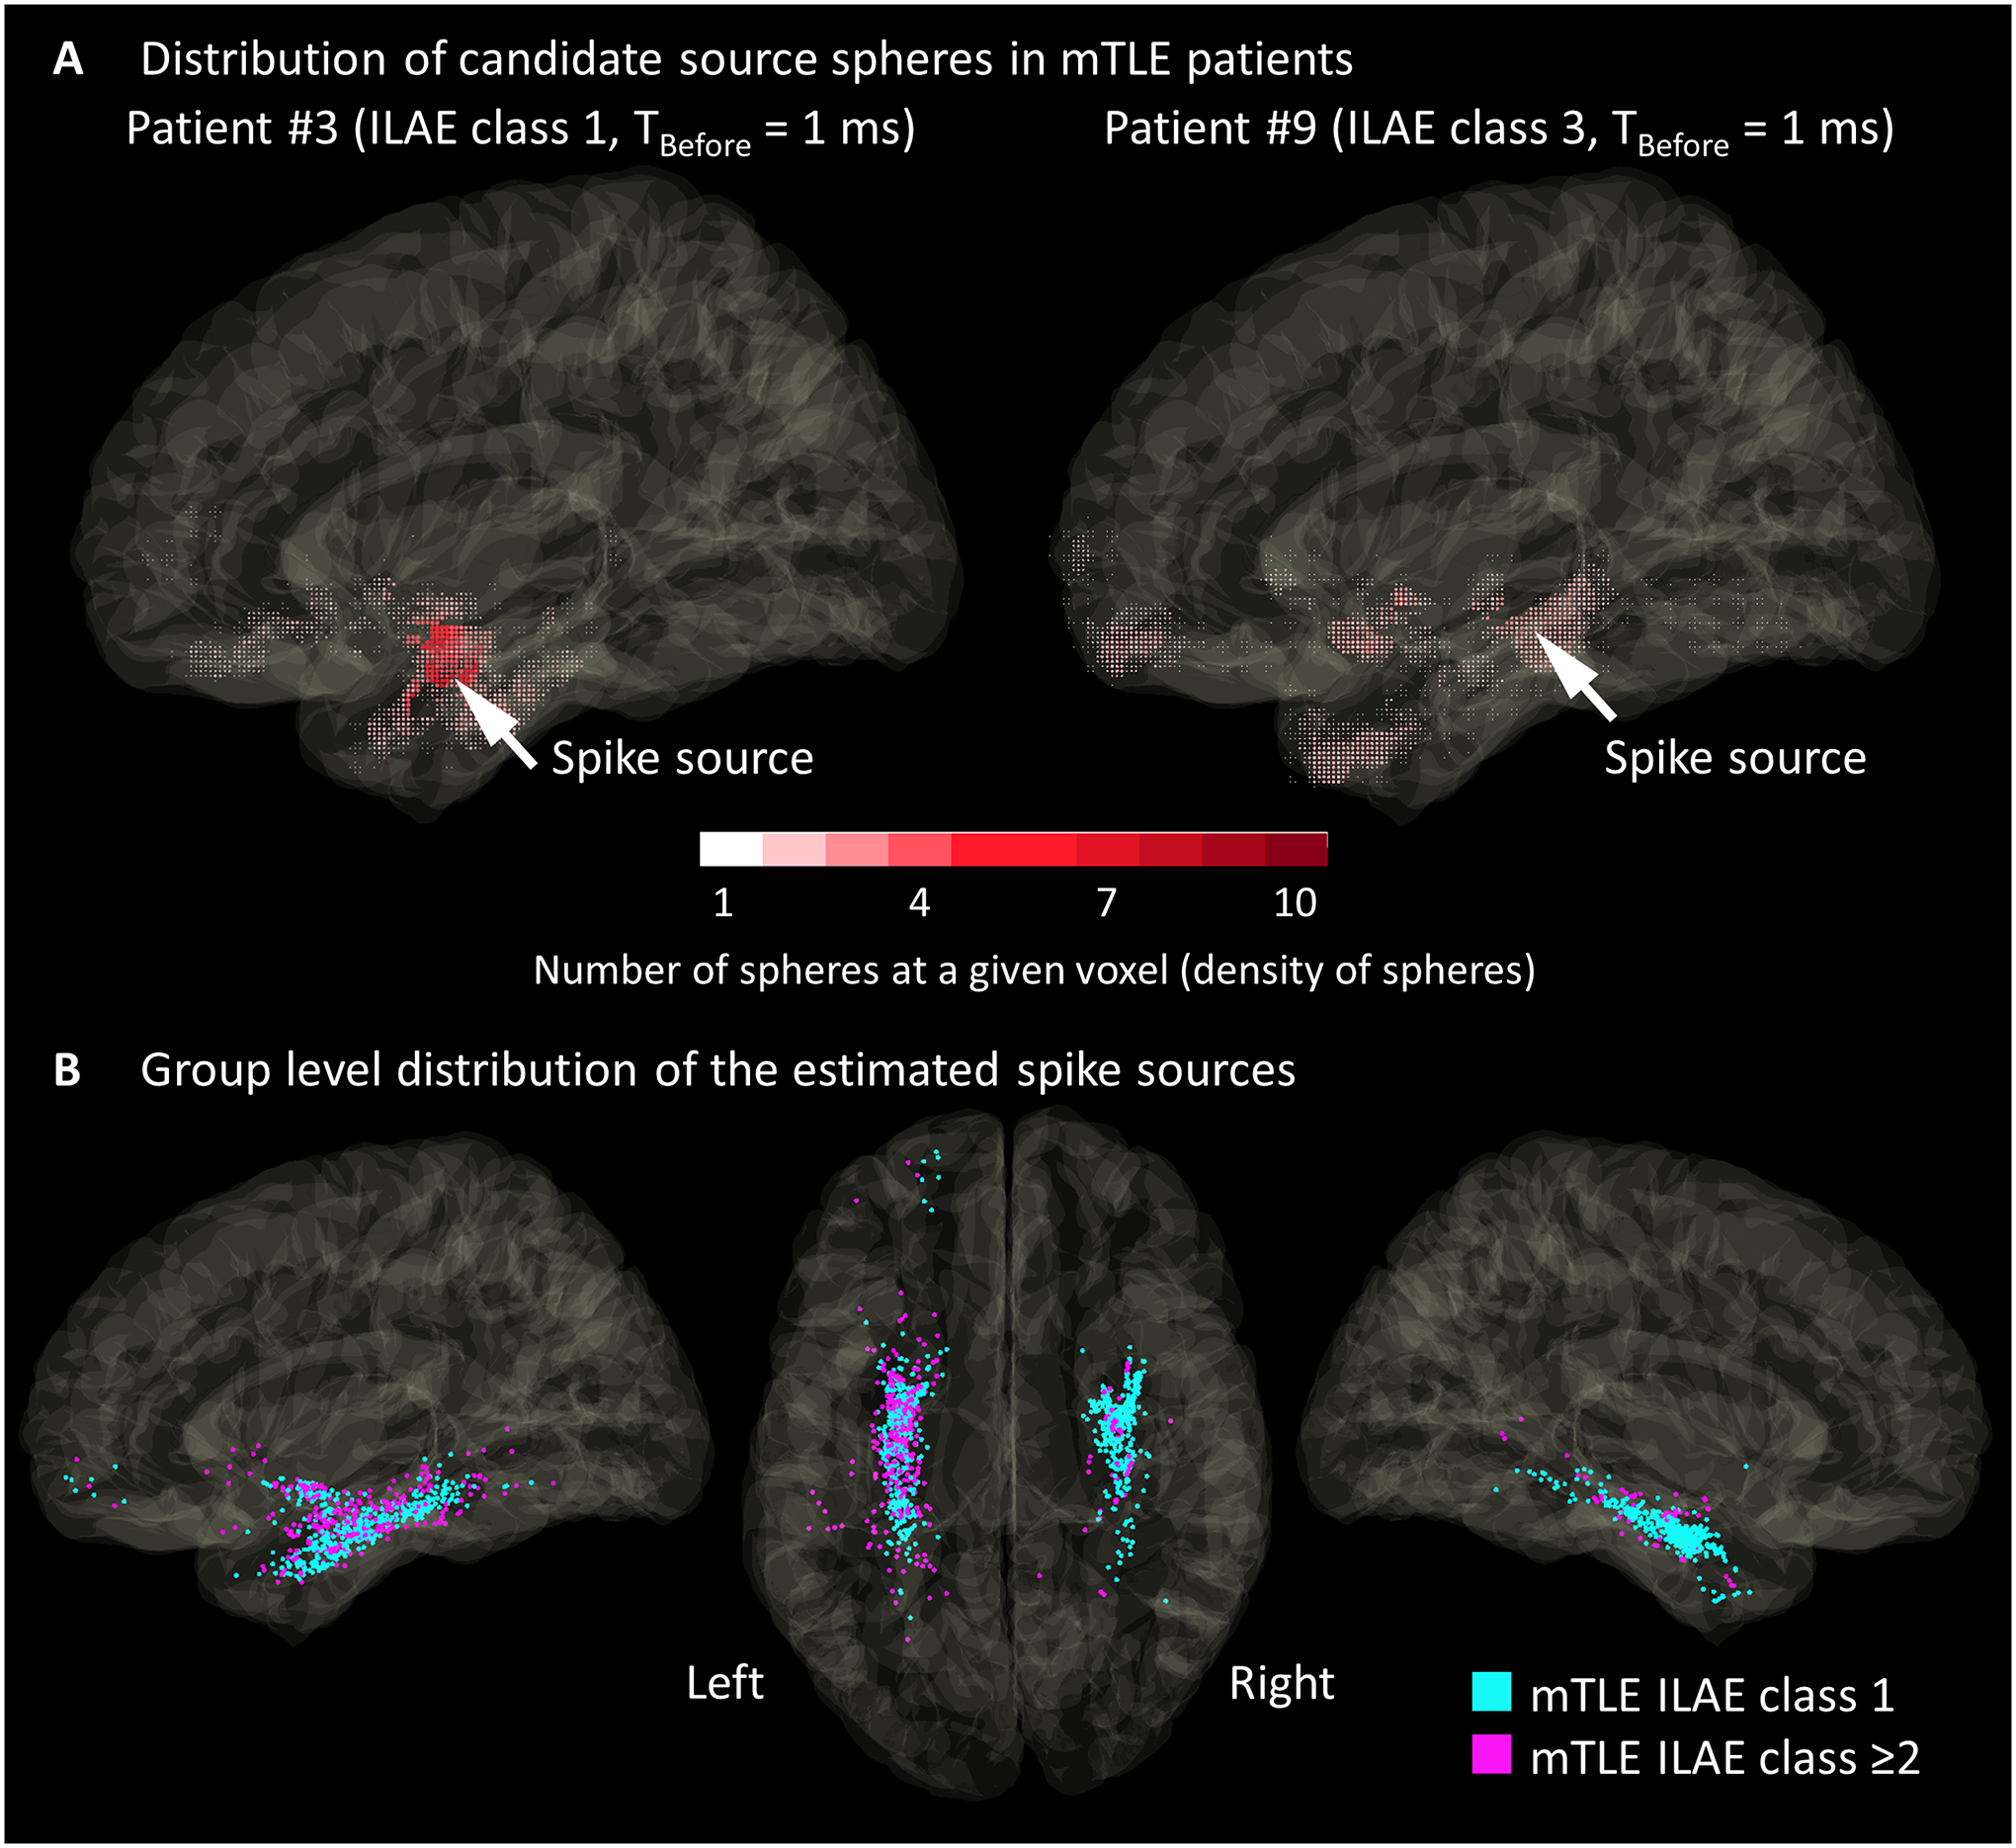
Figure 4. The distribution of spike sources.

(A) The distributions of candidate source spheres for a spike event of Patients #3 and #9. Each dot indicates the location of a candidate source sphere. The dot color reflects the density of candidate source spheres at a given voxel. For each spike event, the spike source (arrow) was defined to be localized at the center of gravity of these spheres. (B) Distribution of spike sources seen in 12 patients with mesial temporal lobe epilepsy (mTLE). Cyan dots: 800 spike sources seen in patients with the class-1 outcome. Magenta dots: 400 spike sources in those with class ≥2 outcomes.
