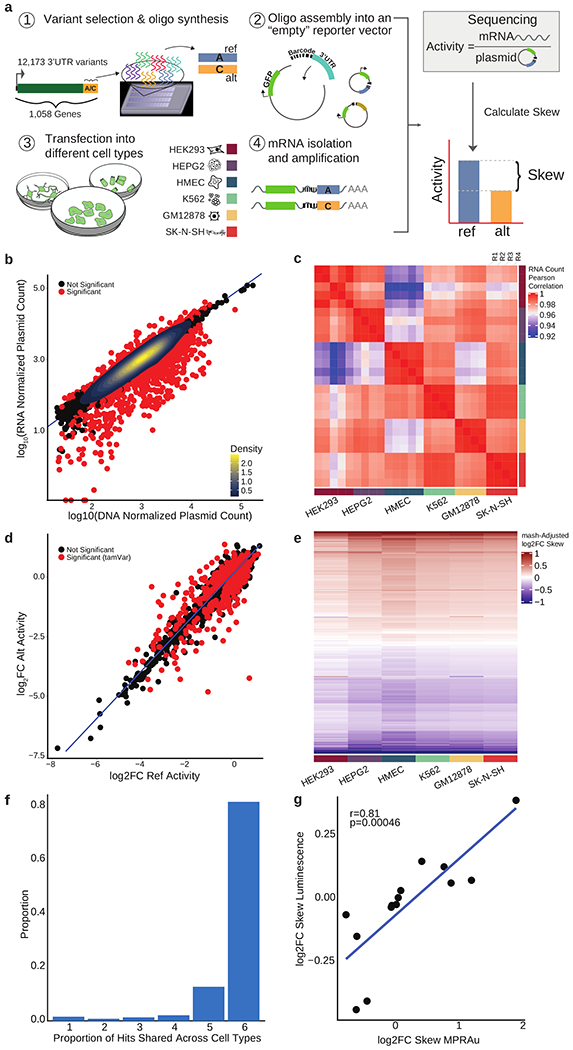
Figure 1: MPRAu reproducibly recapitulates known 3’UTR activity.

a, Overview of MPRAu: (1) Synthesis of oligonucleotide 3’UTR elements with genomic variants. (2) Oligos are PCR-amplified and cloned into a vector 3’ of GFP and adjacent to a random hexamer barcode. (3) The vector pool is transfected into cells, (4) GFP mRNA is extracted and sequenced. mRNA sequencing counts (4) are compared to plasmid counts (2) to determine the relative expression of ref and alt alleles. b, Scatterplot of normalized RNA versus DNA counts in HEK293 cells. Most oligos with significant activity are observed having attenuating effects. c, Heatmap of the pairwise correlation of RNA counts across all replicates. d, Identification of tamVars (red), variants with significantly different alt versus ref activity (data for HEK293 plotted). e, mash adjusted log2FC allelic skews for all variants with significant effects in at least one cell type (rows) across all tested cell types. f, Barplot depicting tamVar sharing across one to all six cell types. g, tamVar allelic skews concordance with low-throughput luciferase assays. Pearson’s r and its statistical significance are displayed.
