
Figure 2: Functional 3’UTR elements overlap known 3’UTR annotations.
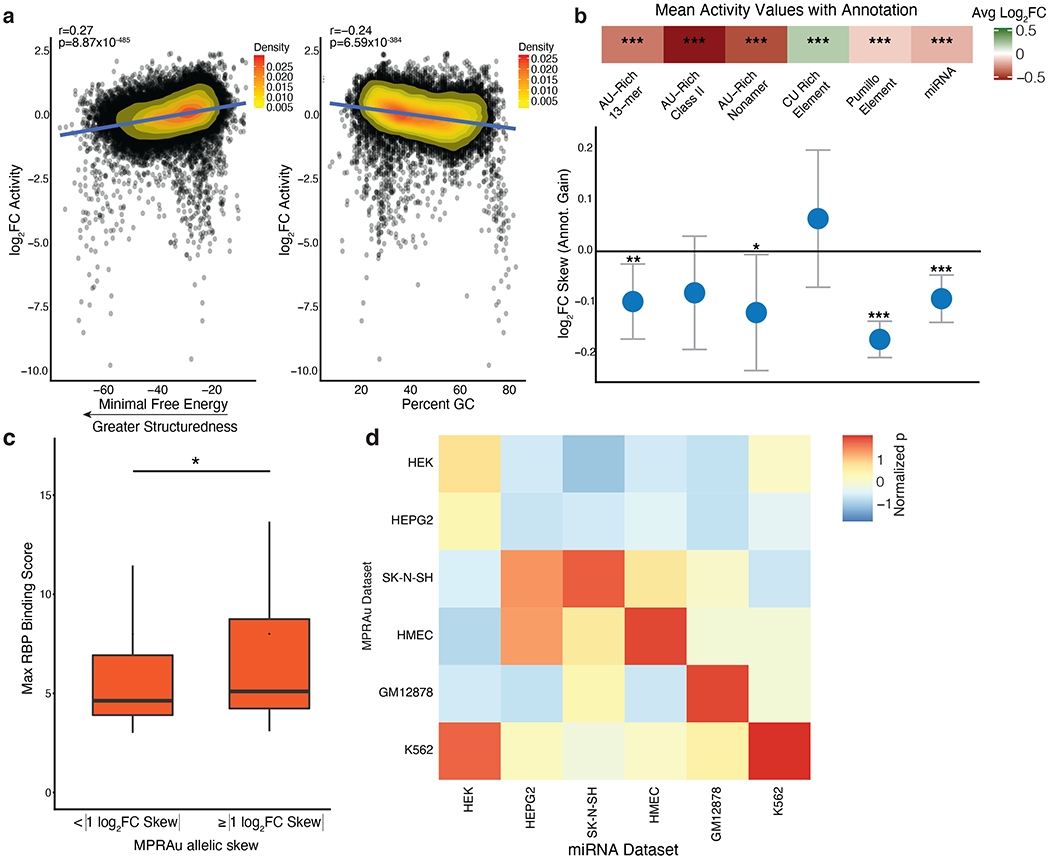
a, Scatterplot comparing correlations between activity effects and 3’UTR structure (more negative minimum free energy, left) and percent GC (right). HMEC log2FC activity data is representative and plotted. Pearson’s r and its statistical significance are displayed. b, (top panel) Enrichment of significantly active 3’UTRs with known 3’UTR attenuating (AU-rich, Pumillo, and miRNA) and augmenting (CU-rich Element) annotations. Average log2FC of 3’UTR activity in MPRAu across all cell types with specified annotation plotted, significance denoted as *** p-value<0.001, ** p-value<0.01, * p-value<0.05, using a two-sided Wilcoxon rank-sum test. (bottom panel) Barplot of the allelic skews for variants that acquire 3’UTR annotations of the class listed above. c, Variants with high allelic skew (| log2FC Skew |≥1 ) have greater in-vivo eCLIP RBP binding scores than variants with a lesser allelic skew (* p-value<0.05, using a one-sided Wilcoxon rank-sum test). d, Each box in the heatmap measures the significance of attenuation (t-test) when cell-type-specific MPRAu-measured 3’UTR activity (y-axis) is subsetted on the top 10 most abundant miRNAs across the cell types tested (x-axis). Across 4 cell types (K562, HMEC, GM12878, SK-N-SH), 3’UTR activity was most significantly attenuated when subsetting on cell-type matched miRNAs.