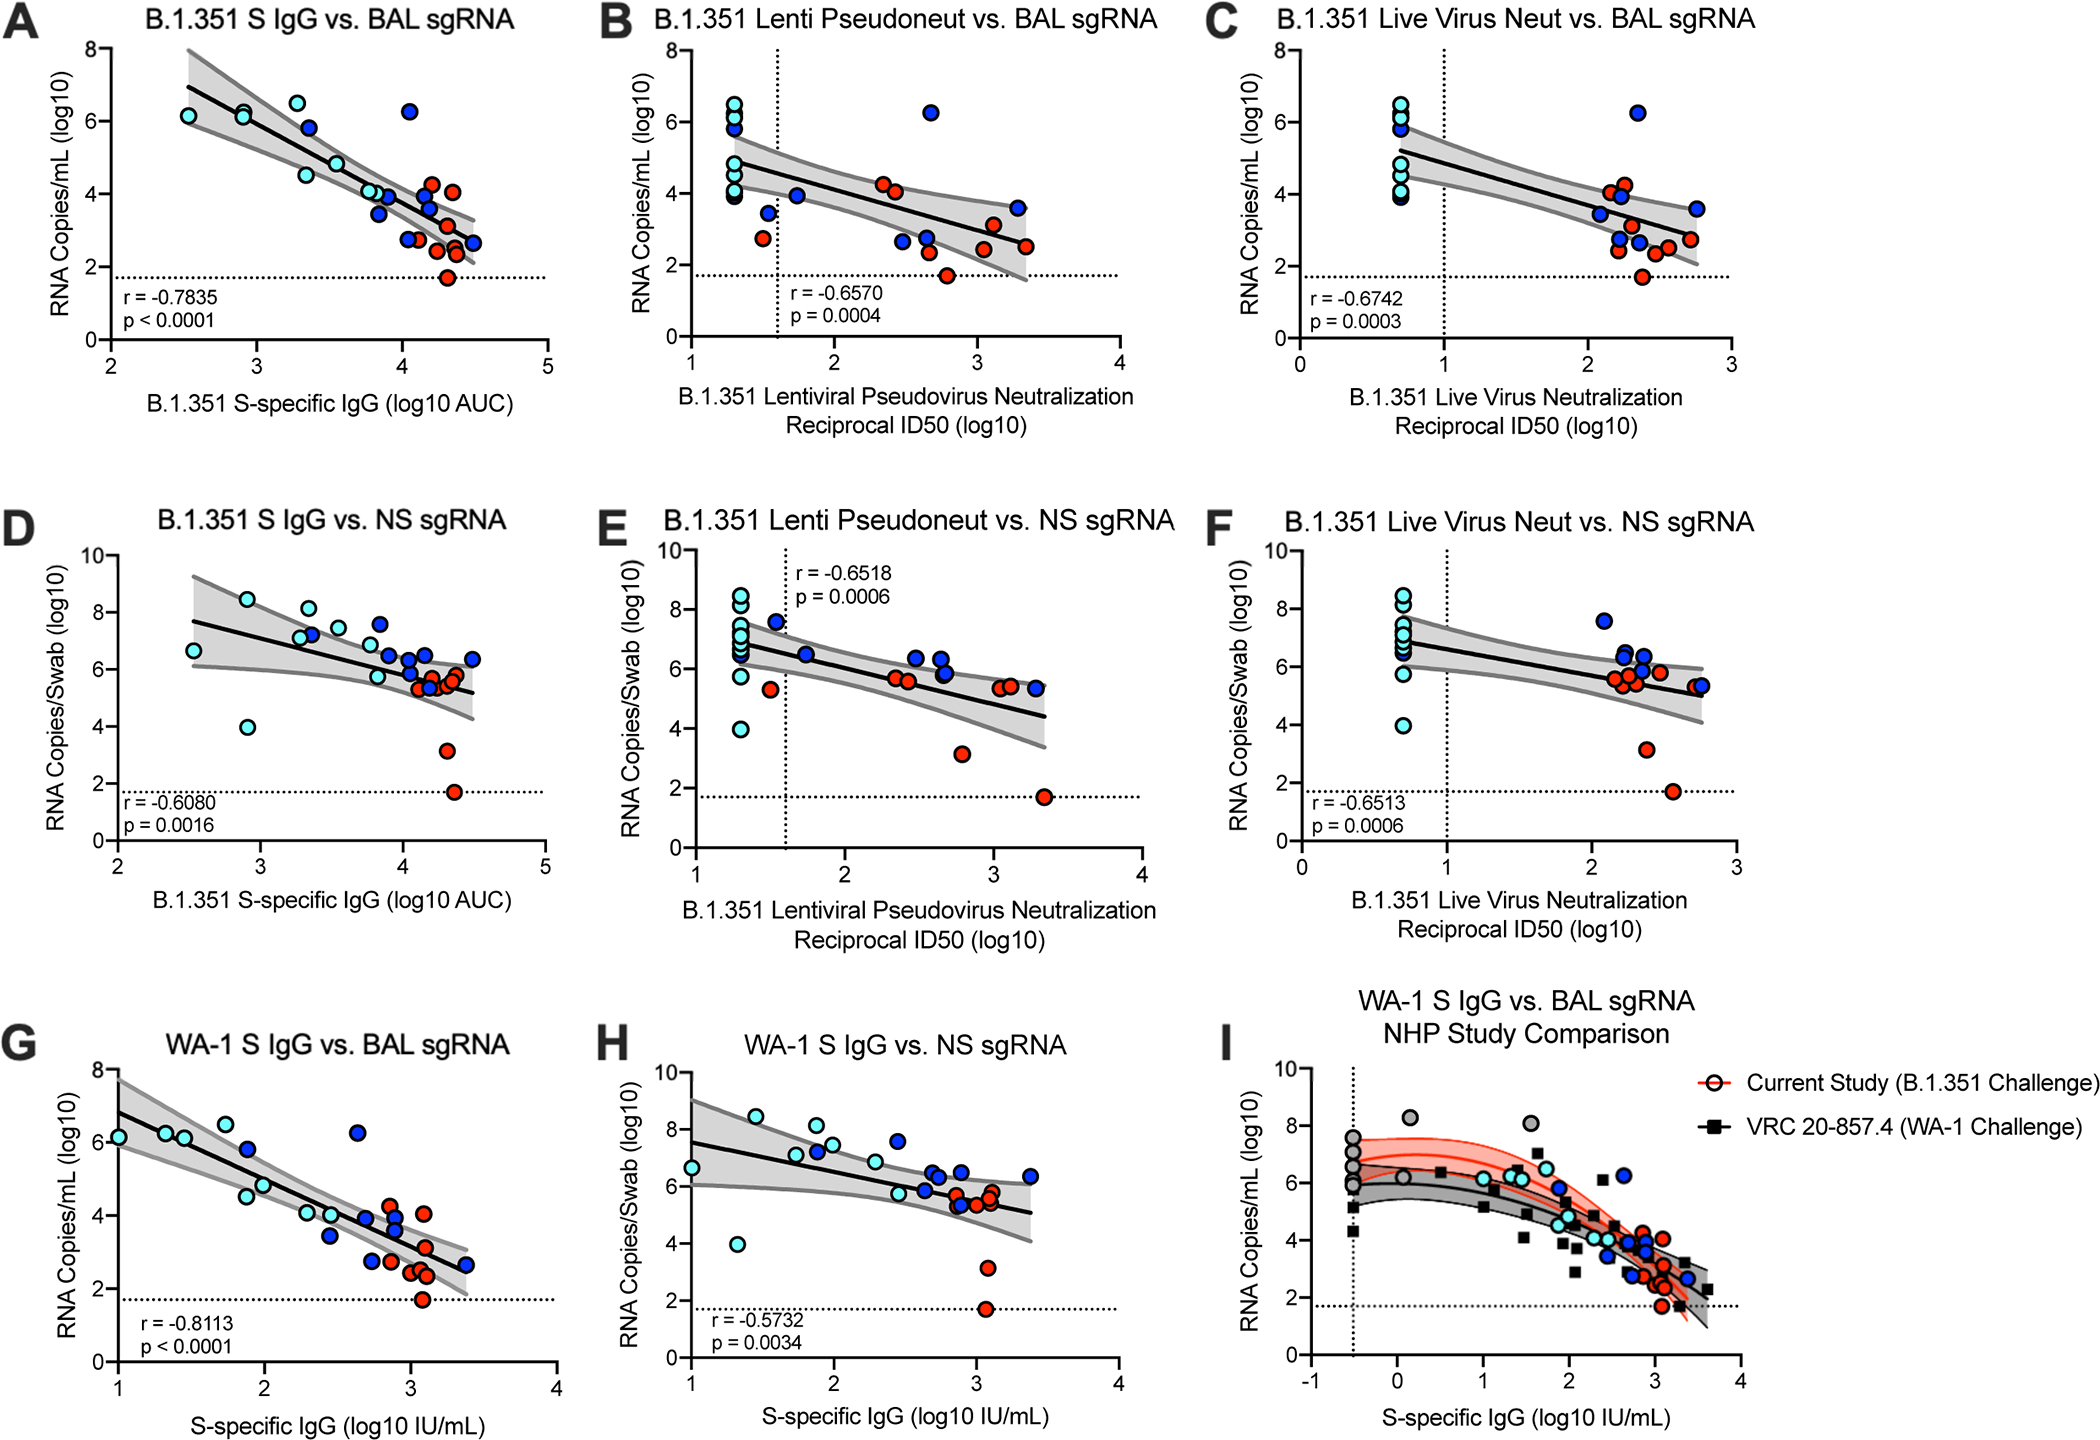
Fig. 6. Antibody correlates of protection.

Twenty-four rhesus macaques were immunized and challenged as described in Extended Data Fig. 1, and compared to eight age-matched controls. (A-F) Plots show correlations and the corresponding two-sided p-values between week 12 SARS-CoV-2 B.1.351 S-specific IgG (A, D), lentiviral-based pseudovirus neutralization (B, E), and focus reduction live-virus neutralization (C, F) with N-specific sgRNA in BAL (A-C) and NS (D-F) at day 2 post-challenge. (G-H) Plots show correlations and the corresponding two-sided p-values between week 12 SARS-CoV-2 WA-1 S-specific IgG, converted to IU/mL, with N-specific sgRNA in BAL (G) and NS (H) at day 2 post-challenge. Circles represent individual NHP, where colors indicate mRNA-1273 dose. Dotted lines indicate assay limits of detection. (I) The relationship between pre-challenge WA-1 S-specific IgG and day 2 BAL sgRNA_N, with data from the current study using a B.1.351 challenge (filled circles, red curve fit) superimposed on data from our previous study with a WA-1 challenge (black squares, black curve fit); lines indicate quadratic curve fit and 95% confidence intervals. Data represents one independent experiment.
Symbols represent individual NHP and may overlap for equal values.
