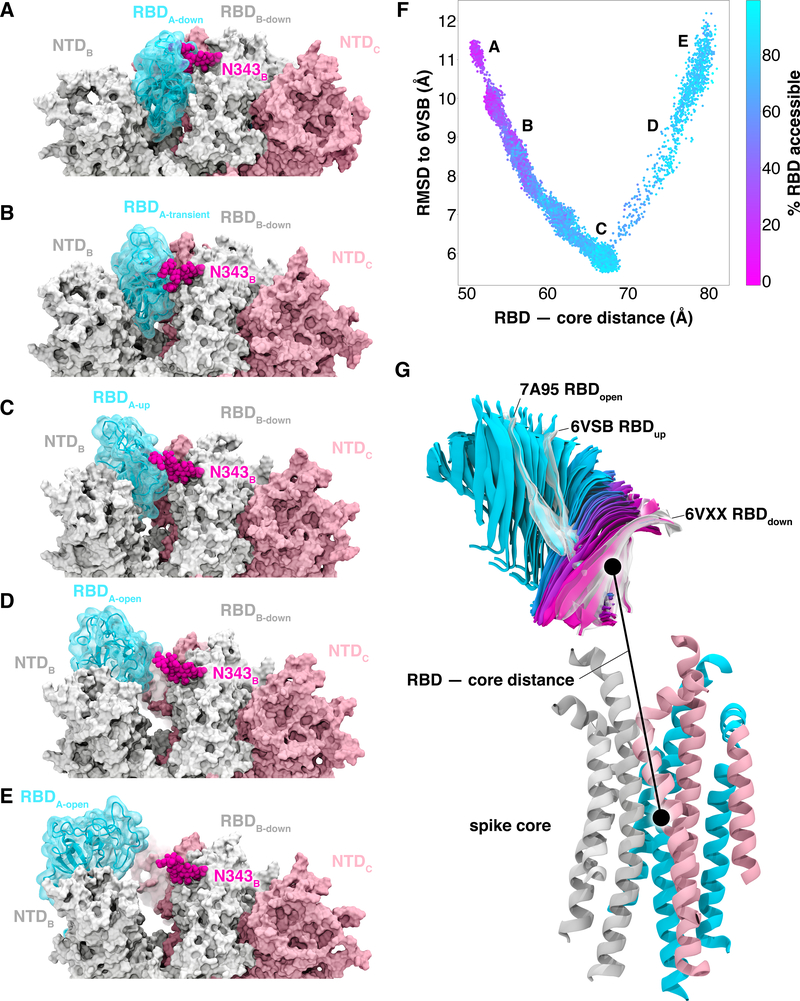
Figure 2.
Atomically detailed pathways of spike opening. (A-E) Snapshot configurations along the opening pathway with chain A shown in cyan, chain B in gray, and chain C in pink and the glycan at position N343 is shown in magenta. (F) Scatter plot of data from the 310 continuous pathways with the Cα RMSD of the RBD from the 6VSB “up” state plotted against the RBD —core distance. Data points are colored based on % RBD solvent accessible surface area compared to the RBD “down” state 6VXX. Location of snapshots shown in A-E are labeled. (G) Primary regions of spike defined for tracking progress of the opening transition. The spike core is composed of three central helices per trimer, colored according to chain as in (A-E). The RBD contains a structured pair of antiparallel beta sheets and an overlay of snapshots from a continuous WE simulation are shown colored along a spectrum resembling the palette in (F). Overlayed cryoEM structures are highlighted and labeled including the initial RBD “down” state, 6VXX, the target RBD “up” state and the ACE2 bound “open” state, 7A95.

