
Figure 2. Characterization of NIHCOLE expression and depletion in HCC cells.
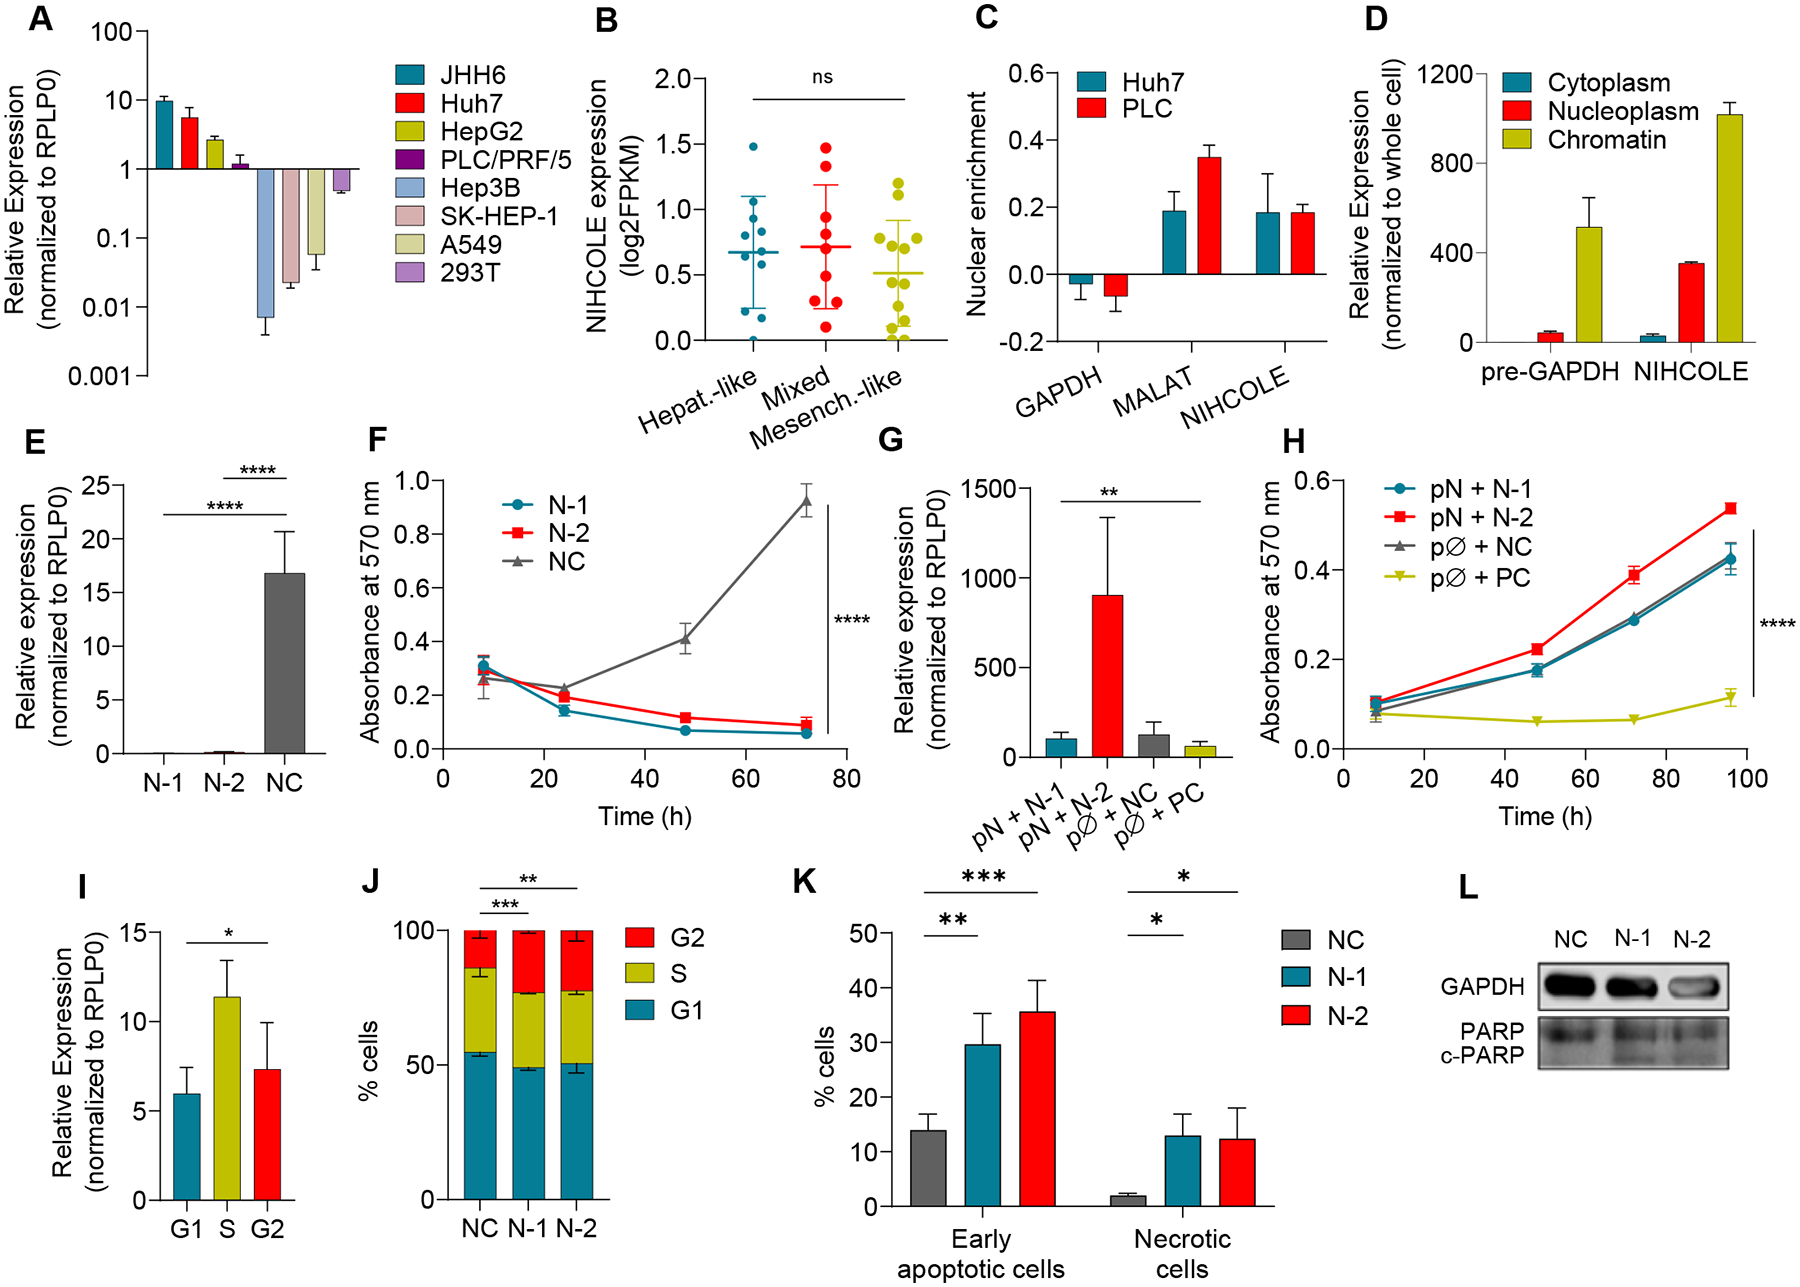
A NIHCOLE levels in HCC and non-HCC cell lines (in lighter shades) by qRT-PCR. Mean ± SD (n = 3–6) B Expression of NIHCOLE from RNA-Seq data of 33 HCC cell lines in a differentiation gradient from hepatoblast-like (Hepat.-like, n = 11), mixed epithelial-mesenchymal (Mixed, n = 9) to mesenchymal-like (Mesench.-like, n = 13). C, D Enrichment of NIHCOLE in the nucleus versus cytoplasm (C) or nucleoplasm versus chromatin (D). Mean ± SD (n = 3). GAPDH mRNA or pre-mRNA and MALAT1 levels were used as controls. E, F Huh7 cells were transfected with two specific gapmers (N-1 and N-2) and a non-targeting negative control (NC). NIHCOLE expression 48 hours post-transfection (E; mean ± SD (n = 5)) and proliferation by MTT assays (F; mean ± SEM (n = 3)). G, H Adding back experiments. NIHCOLE expressing plasmid (pN) was co-transfected with NIHCOLE’s gapmers. Empty plasmid (pØ), NC gapmer or an ACTN1-specific gapmer (PC) were used as controls. NIHCOLE levels were measured 48h post-transfection (n = 3) (G) and proliferation was measured by MTT assays (H). Mean ± SEM (n = 3). I NIHCOLE expression by qRT-PCR in synchronized Huh7 cells. Mean ± SD (n = 3). J Cell cycle distribution of NIHCOLE-depleted cells. Mean ± SD (n = 3) K, L Apoptosis was measured by Annexin V staining and FACs analysis (K) and by immunoblotting of PARP cleavage (c-PARP) (L) in control and NIHCOLE-depleted cells. GAPDH was used as loading control (n = 3). The significance of the statistical analysis (two-tailed Student’s t test in B, E, F, G, H, I and two-way ANOVA in J) is indicated and summarized as: not significant (ns); * <0.05; **<0.01; ***<0.001; ****<0.0001. See also Figure S3.