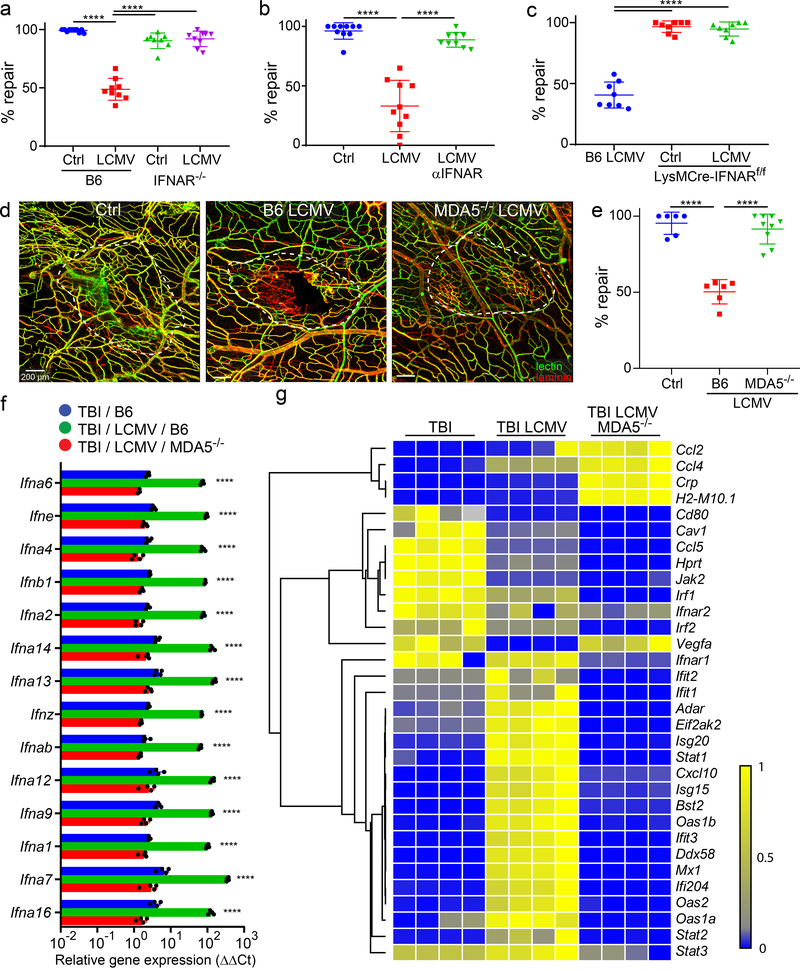
Figure 4. Deletion of pathogen sensing or interferon signaling reconstitutes meningeal repair after mTBI.
a. Dot plot shows quantification of percent lesion repair (mean ± SD) 7 days after mTBI in uninfected B6 (n=10) and and IFNAR−/− (n=8) mice versus LCMV i.v. infected B6 (n=9) and IFNAR−/− (n=9) mice. b. Dot plot shows percent lesion repair 7 days after mTBI in uninfected mice (n=10), LCMV infected mice (n=10), and LCMV infected mice + αIFNAR antibody (n=9). c. Dot plot shows percent lesion repair 7 days after mTBI in LCMV infected B6 mice as well as uninfected and infected LysMCre-IFNARf/f mice (n=8 per group). d. Confocal images show vascular damage and repair in uninfected B6 mice as well as LCMV-infected B6 and MDA5−/− mice at day 7 post-mTBI. The white dotted lines delineate areas of injury and repair. Fluorescent tomato lectin (green); laminin (red); Scale bar, 200 μm. e. Dot plot shows quantification of percent lesion repair (mean ± SD) for the groups in panel d. (Ctrl, B6 LCMV n=6, MDA5−/− LCMV n=9 mice). f. Dot plot depicting qPCR analysis of relative IFN-I gene expression (δδCT) in punch biopsies of meninges and superficial neocortex at day 7 post-mTBI for uninfected B6 mice as well as day 4 LCMV-infected B6 and MDA5−/− mice. Data are representative of two independent experiments 4 and 5 mice per group. g. Heatmap depicting qPCR analysis of type I interferon signaling related genes that were significantly increased (P<0.005) based on two-way ANOVA followed by the Holm-Šídák multiple comparison method. Groups are the same as those shown in panel F. Data are representative of two independent experiments with 4 and 5 mice per group. a, b, c, e, f. Data are representative of two independed experiments. Each symbol represents an individual mouse and asterisks denote statistical significance. Data are represented as mean ± SD. (****P ≤ 0.0001; a, b, c, e One-way ANOVA/Tukey test; f, g Two-way ANOVA/Holm-Sidak test). Source data for a, b, c, e in Source Data Fig. 4 and for f, g in Supplementary Tables 1d, e. Statistical analysis in Supplementary Table 5.

