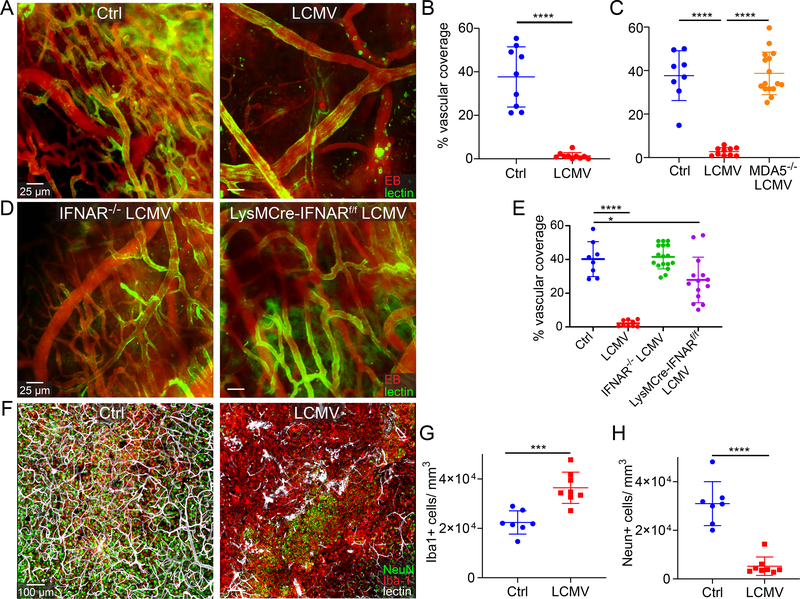
Figure 6. Viral infection and subsequent interferon signaling blocks angiogenesis after cerebrovascular injury.
a-e. Intravital 2-photon microscopy of cerebral cortical vasculature and image-based quantification of vascular coverage at day 10 post-cerebrovascular injury (CVI). Fluorescent tomato lectin (green) and Evans blue (red, EB) were injected i.v. prior to imaging. Scale bar, 25 μm. a. Representative images show parenchymal vasculature in the neocortex of uninfected and LCMV-infected B6 mice at day 10 post-CVI. b. Dot plot shows quantification of vascular coverage for the groups in panel a (Ctrl n=9, LCMV n=10). c. Dot plot depicts quantification of parenchymal vascular coverage at day 10 post-CVI in uninfected B6 mice (Ctrl) as well LCMV-infected B6 and MDA5−/− mice (Ctrl n=8, LCMV n=10, MDA5−/− LCMV n=16). d. Representative two-photon images show vascular coverage at day 10 post-CVI in day 4 LCMV-infected IFNAR−/− and LysMCre-IFNARf/f mice. e. Dot plot shows quantification of vascular coverage at day 10 post-CVI for uninfected B6 mice (Ctrl) as well as day 4 LCMV-infected B6, IFNAR−/−, and LysMCre-IFNARf/f mice (Ctrl =8, LCMV n=9, IFNAR−/− LCMV n=17, LysMCre-IFNARf/f LCMV n=14). f. Representative confocal microscopy images of neocortex at day 10 post-CVI show NeuN+ neurons (green), Iba-1+ myeloid cells (red), and fluorescent tomato lectin labeled blood vessels (white) for uninfected (Ctrl) and d4 LCMV-infected B6 mice. Scale bar, 100 μm. g, h. Dot plots demonstrate image-based quantification of Iba1+ myeloid cells (g) and NeuN+ neurons (h). (Ctrl n=7, LCMV n=8). b, c, e, g, h. Data are represented as mean ± SD and are a compilation of two independent experiments. Each symbol represents an individual mouse, and asterisks denote statistical significance (***P ≤ 0.001, ****P ≤ 0.0001; c, e One-way ANOVA/Tukey test; b, g, h Two-tailed Student’s t-test). Source data for b, c, e, g, h in Source Data Fig. 6. Statistical analysis in Supplementary Table 5.

